

Skilled nursing facilities operate with tight margins and the pandemic has only sharpened that reality. Review initial findings from our SNF Cost Comparison and Indu...
Key insights
- Review the interplay of operational fundamentals and external market factors to help you identify opportunities for your skilled nursing facility.
- Three fundamental drivers impact SNF operational performance: occupancy, skilled mix, and staffing.
- We take a preliminary look at the data to see how these factors are driving financial performance in skilled nursing facilities.
The rapid pace of change during the COVID-19 pandemic — particularly for the skilled nursing facility (SNF) industry — along with the increased pressure on clinical and operational outcomes, has found many SNF stakeholders yearning for a simple and clearer perspective of the industry.
Focusing on the fundamentals can help drive operational results, but first you need to understand what the broad market factors are signaling about the industry. With a pulse on both the internal and external signals, you can exponentially increase your ability to identify and execute on opportunities for your SNF.
Want to read the full report?
We take an initial look at annual SNF cost report data released by the Centers for Medicare & Medicaid Services (CMS) as of July 2021, and then break it down so you can see how your organization measures up.
Operational fundamentals
Earnings before interest, depreciation, and amortization (EBIDA) is a commonly used profitability measure, but it may not be an accurate indicator of sustainable financial performance — especially through all the noise of the various COVID-19 funding sources. Instead, you may find better insight into your SNF’s operational performance using these three fundamental drivers: occupancy, skilled mix, and staffing.
Occupancy
As COVID-19 spread throughout the country in 2020, unprecedented dynamics contributed to an alarming trend: the worst year-over-year decline in SNF occupancy, ever.
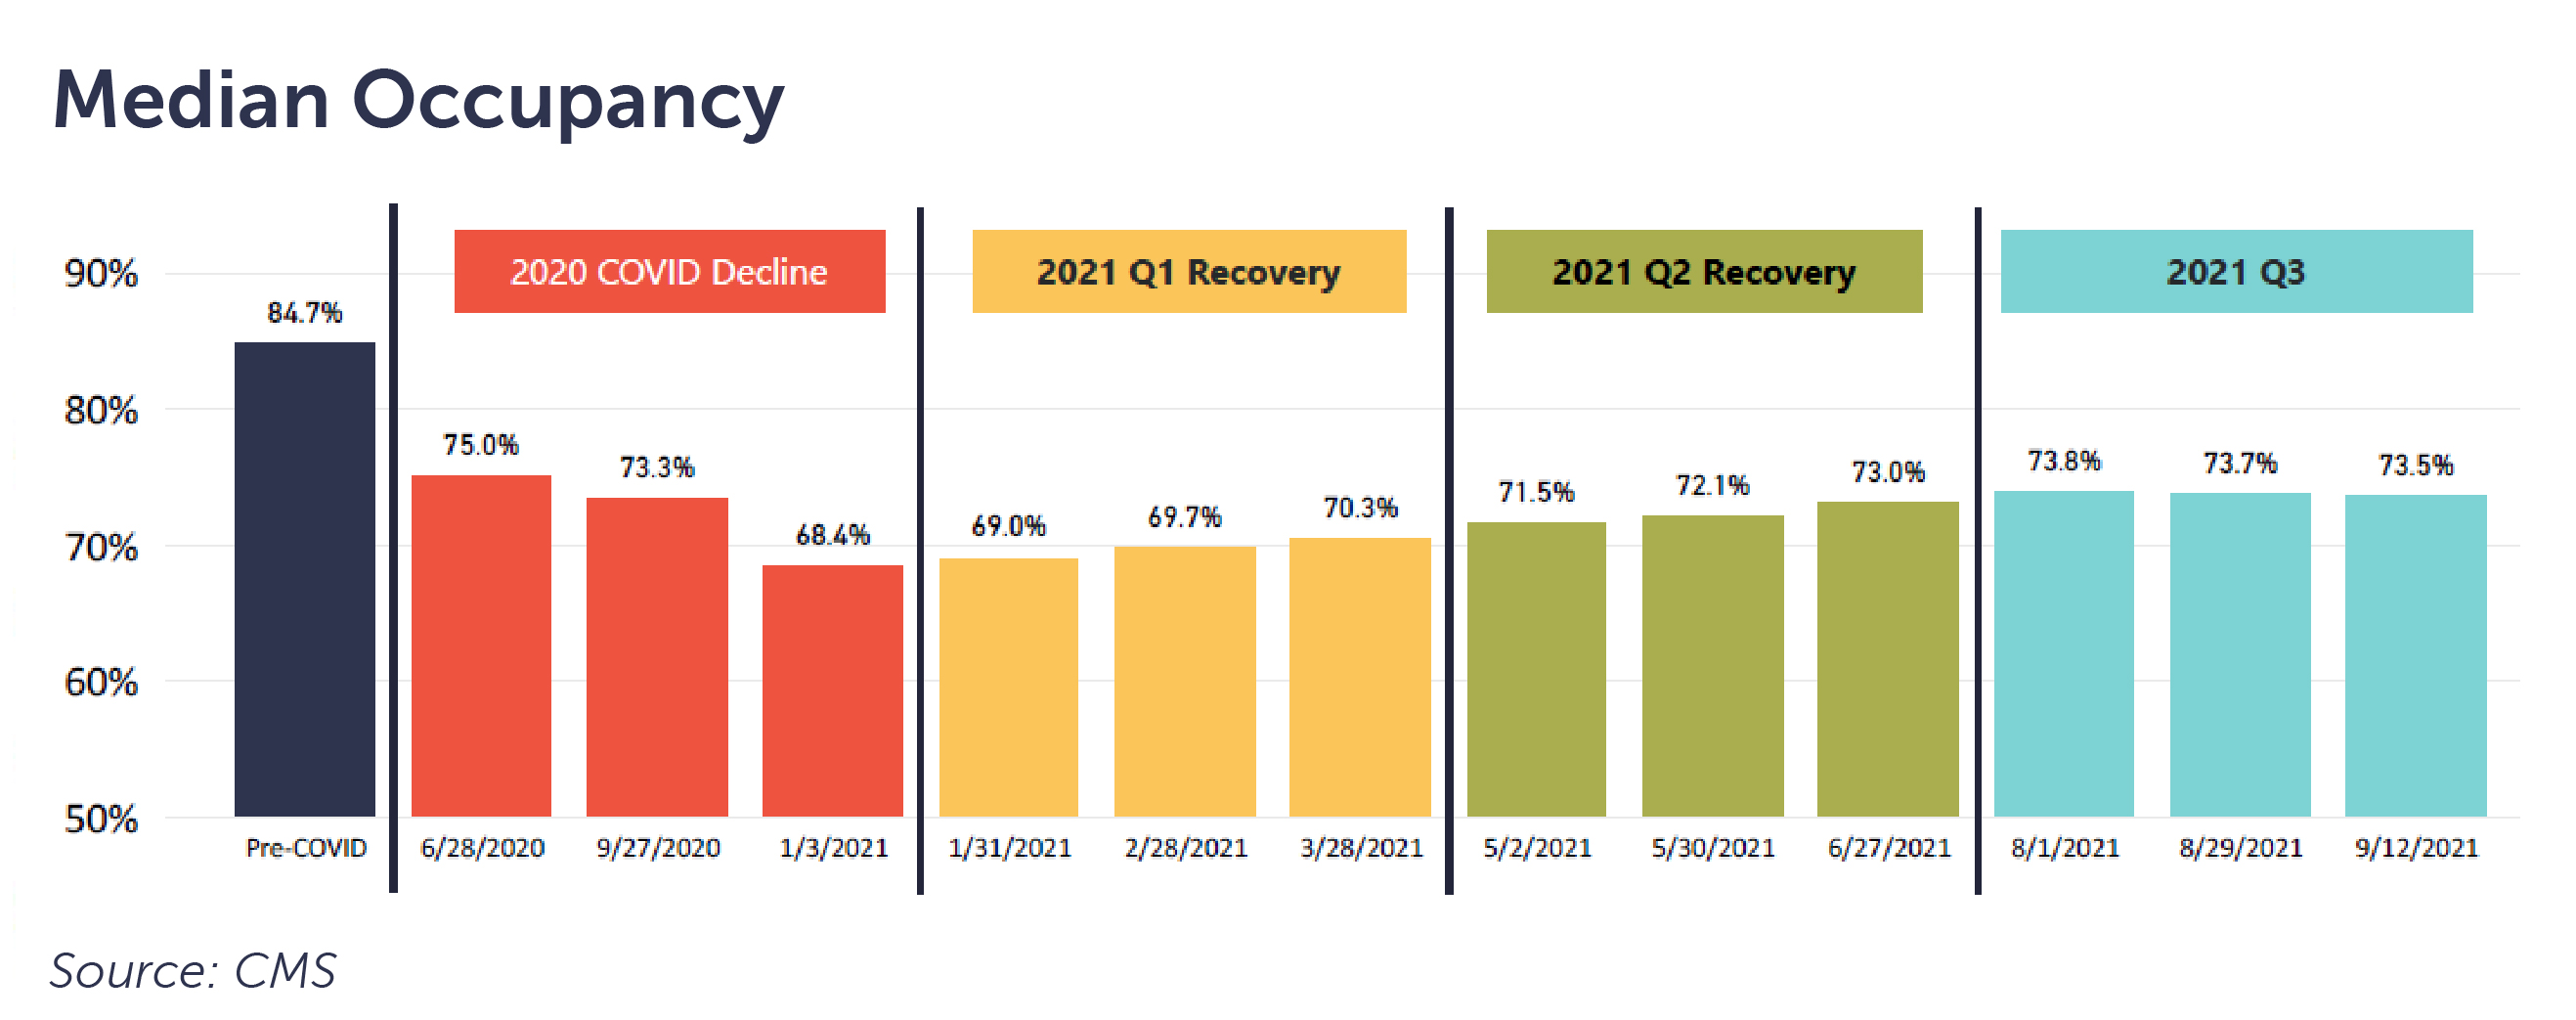
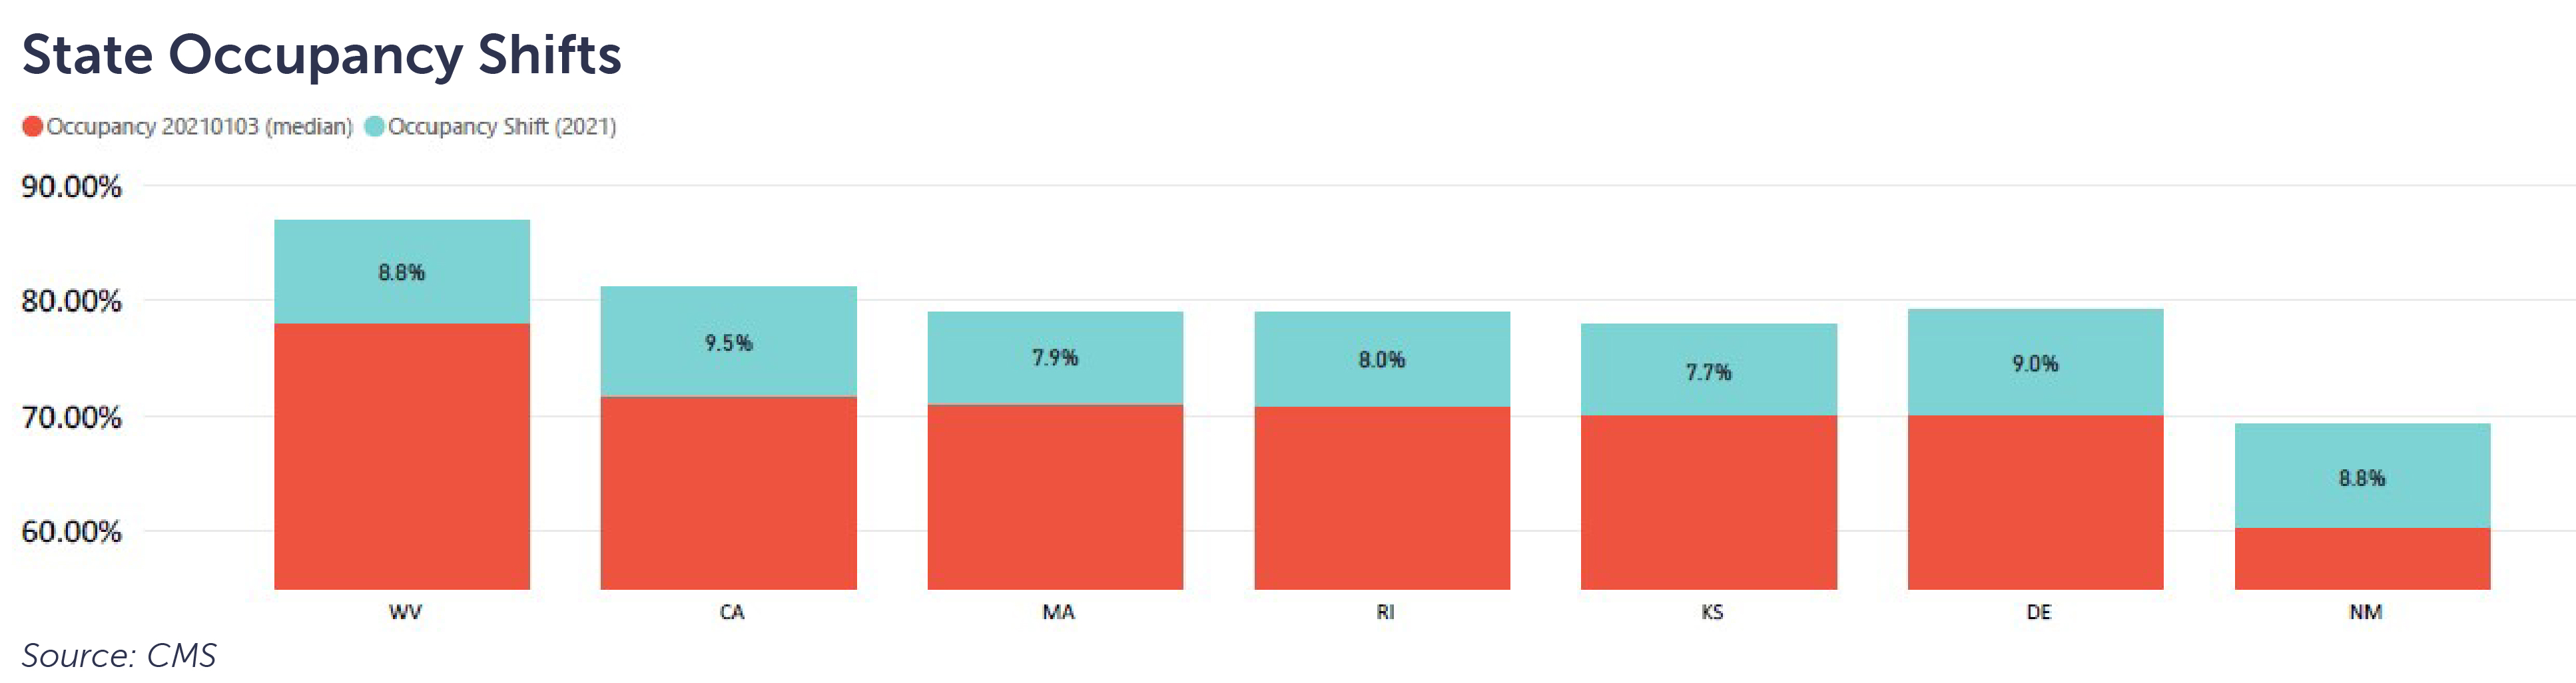
Through the first eight months of 2021, seven states are recovering at a rate of approximately one percentage point per month. Operators in these states may find comfort in this rate of recovery, provided they have been able to maintain appropriate staffing levels to care for the patients they are admitting.
Some facilities in these states may be frustrated to have experienced little to no recovery as they struggle to find staff to support further admissions. Others may have the capacity but are not experiencing the same rate of recovery, leading them to wonder why.
As occupancy increases, there is a disproportionately positive impact to a SNF’s operating margins. This is due to the correlation of covering fixed costs, while incrementally increasing variable costs. As reported in CLA’s 35th SNF Cost Comparison and Industry Trends Report, median operating margins were 0% pre-COVID.
The immediate, drastic, and sustained reductions in occupancy effectively eliminated any operational leverage SNF operators had pre-pandemic. While growing occupancy is critical, growth is dependent on an operator’s ability to incrementally increase staffing in correlation with patient admissions. Operators must also consider the reimbursement associated with the admissions.
Skilled mix
Looking at your mix of short- and long-stay patients can provide insight into the resources needed to provide care and reimbursement received in exchange. Short-stay episodic patients transitioning from the acute care setting to post-acute care require substantial resources compared to long-stay patients.
Based on a preliminary empirical analysis of a limited dataset of cost report information, the sample median showed Medicaid and traditional Medicare Part A fee-for-service mix consistent with pre-COVID trends.
Perhaps a better method for understanding acuity is to assess case mix. Centers for Medicare & Medicaid Services case-mix hours are based on minimum data set (MDS) data for each patient. Throughout 2020 and into the first quarter of 2021, the national average expected total (Exp Total) nursing hours per patient day remained consistent at 3.1.
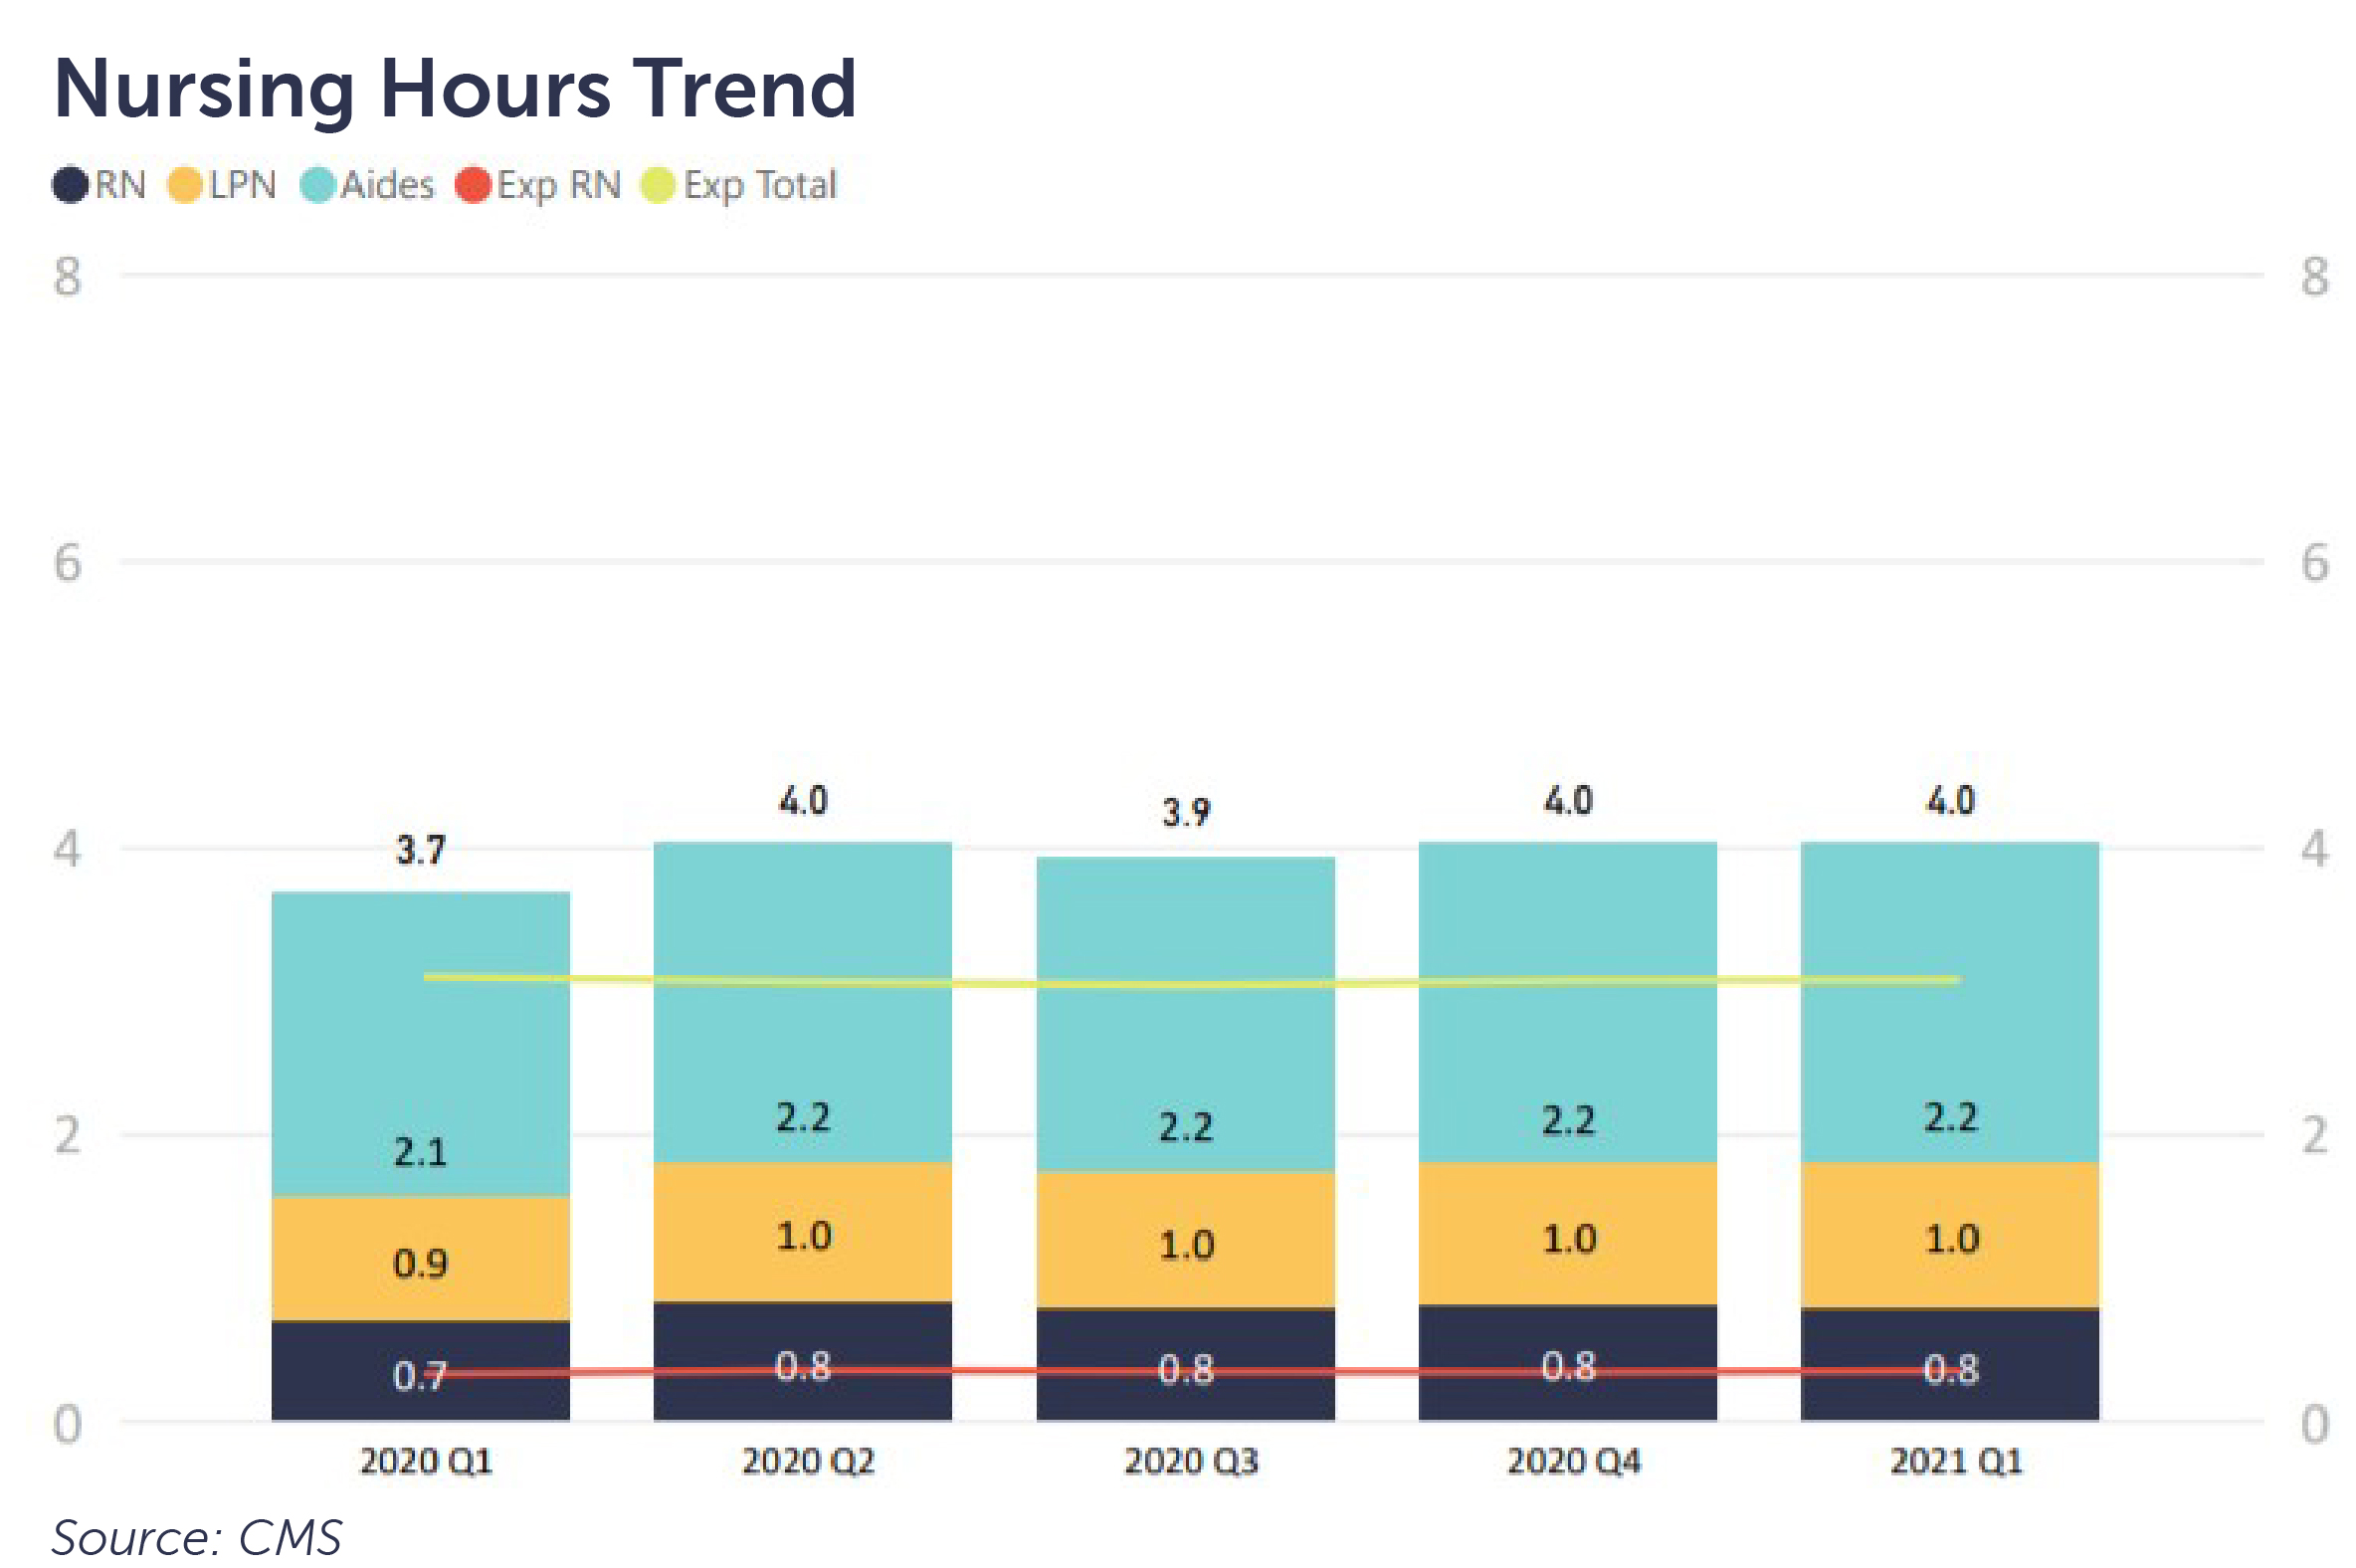
Both the sample cost report data and case-mix hours per patient day suggest it would have been appropriate for staffing levels to remain consistent throughout 2020 before considering COVID-19 factors. This holds true whether a SNF’s case-mix was of higher acuity requiring more RNs and yielding greater reimbursement with potentially greater margins or lower acuity long-stay patients with lower rates and potentially lower margins.
In the pursuit of recapturing lost occupancy, access to labor has been a consistent limiting factor for many operators across the country. While this chart infers an excess of reported staffing capacity compared to expected, each operator has a unique set of opportunities and challenges based on the market(s) in which they operate.
Staffing
Despite the consistency observed in case-mix, the previous chart illustrates another significant factor: a slight increase in average reported nursing hours per patient day from 2020 Q1 (pre-COVID) through the remainder of 2020. A variety of factors helped drive this, including the decline in occupancy and additional labor related to infection control.
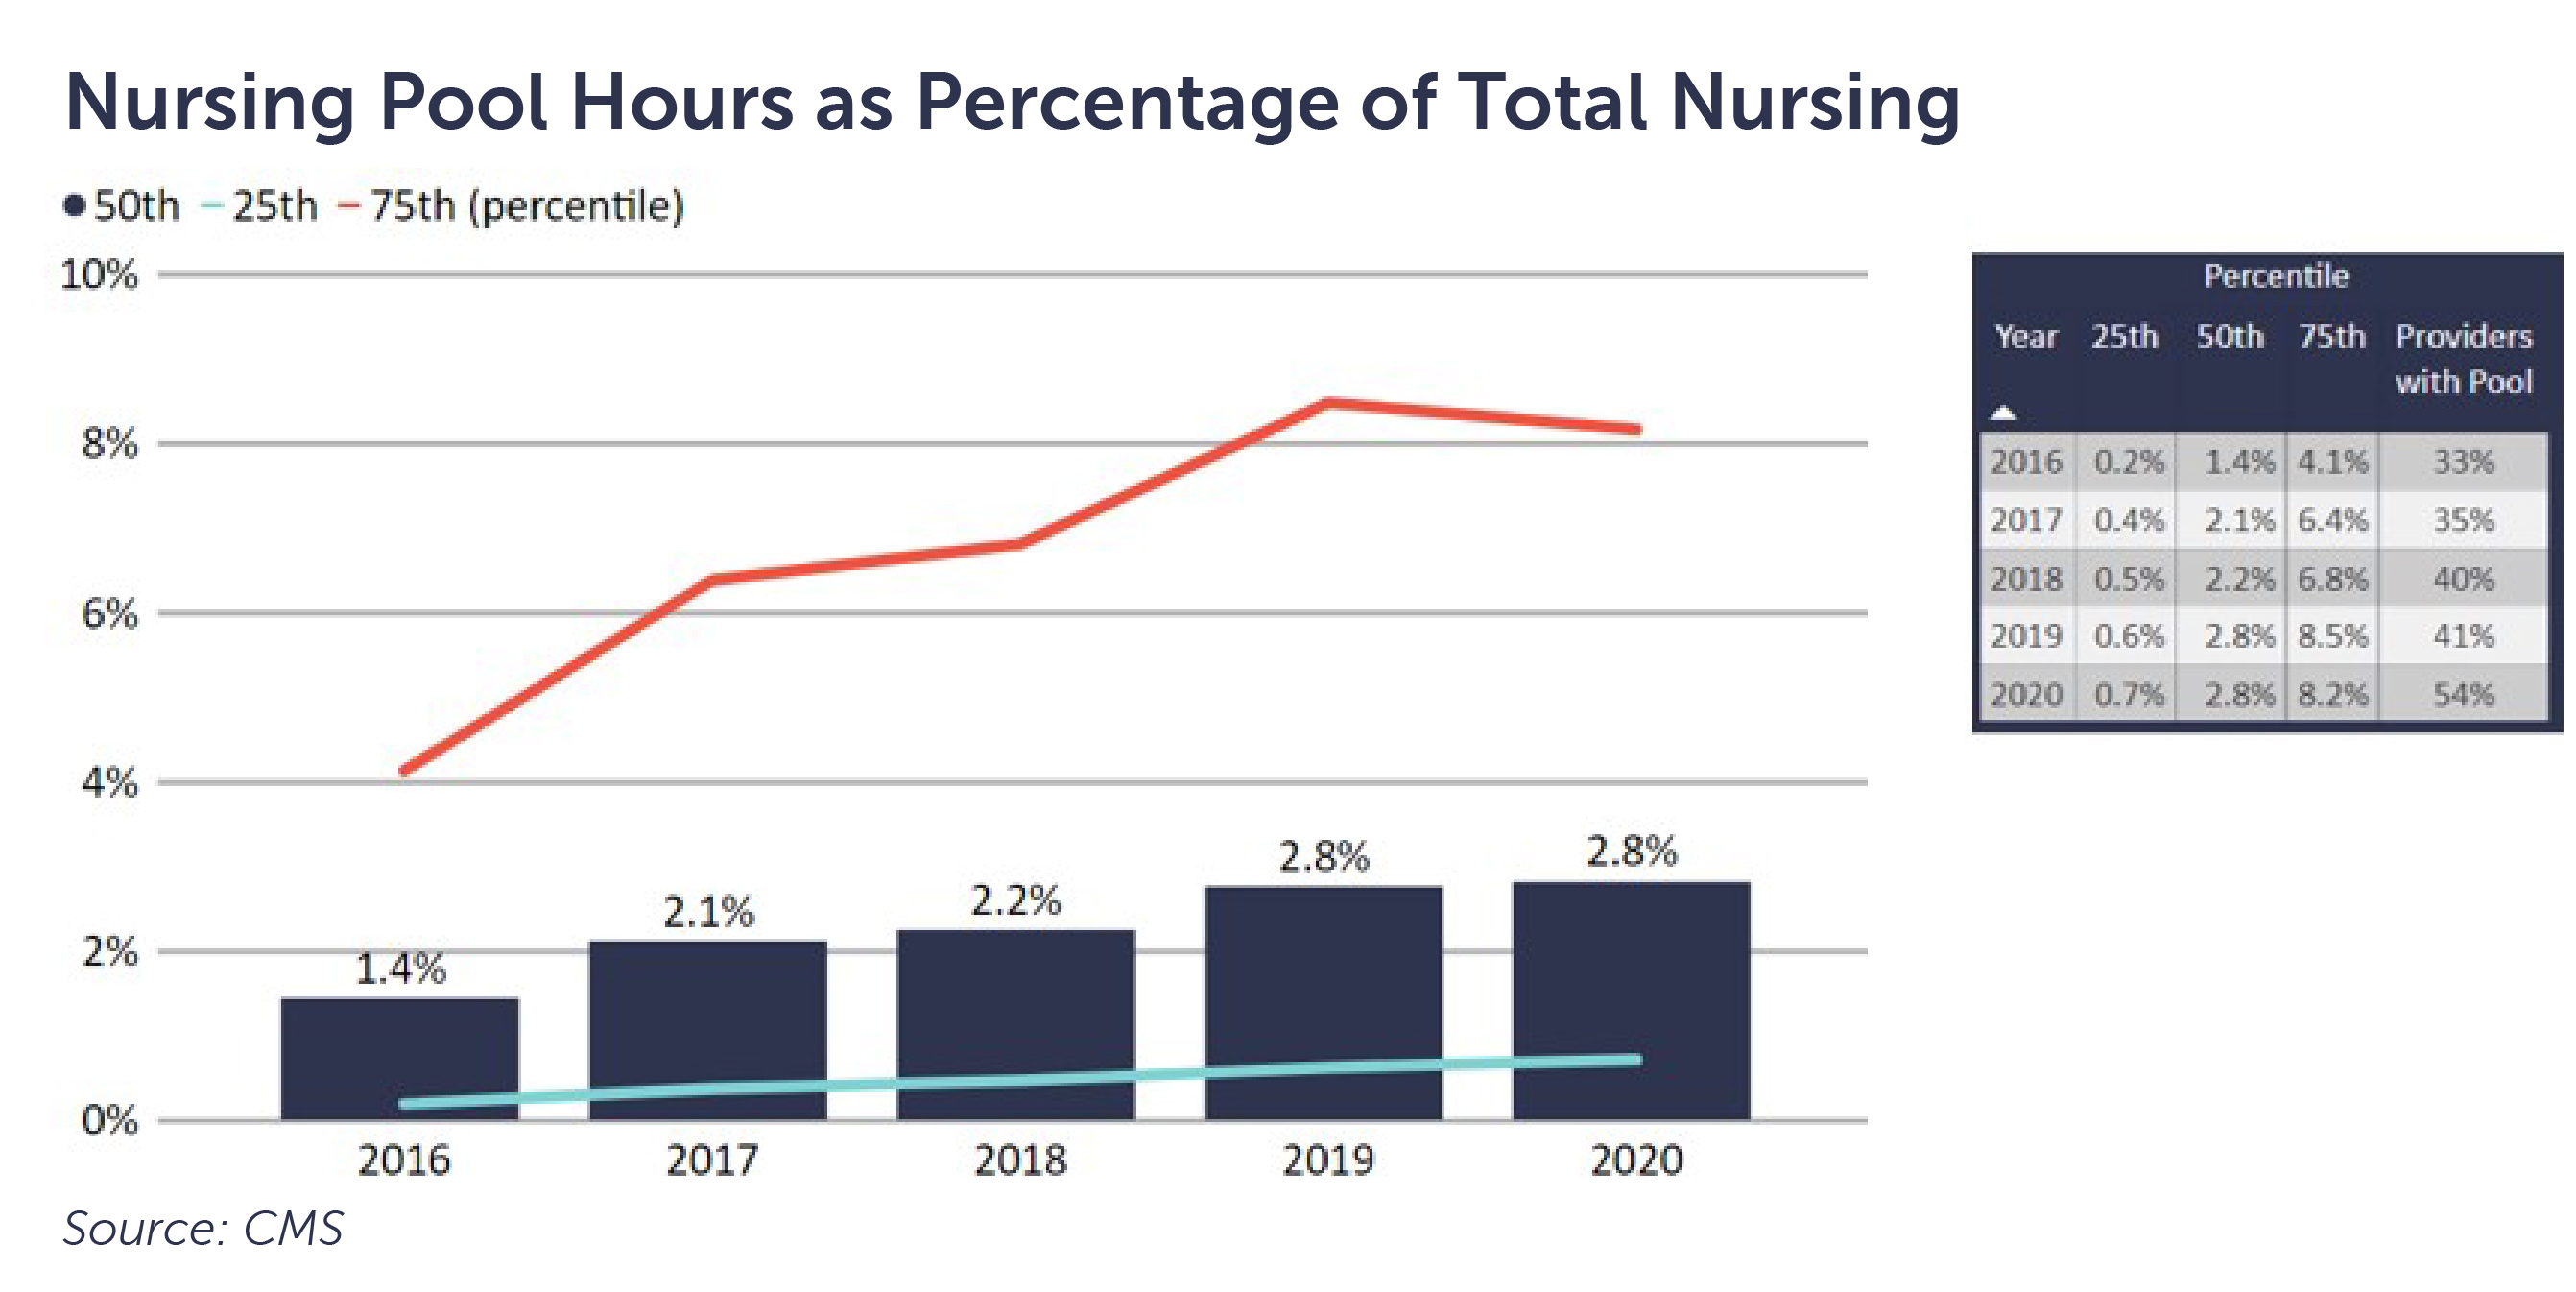
CLA’s 35th SNF Cost Comparison and Industry Trends Report highlighted an increase in facilities utilizing contract nursing. Looking to the sample of available cost report data leads us to infer that trend may continue. Greater than 50% of the facilities reported using contract nursing. The median amount reported by this sample remains consistent with 2019 at 2.8%, while the 75th percentile remains at 8.2%.
The combination of a decline in occupancy, consistent mix, increase in staffing hours per patient day, and higher utilization of contract nursing tells the story of how many facilities have struggled to achieve their financial performance targets in 2020.
These operating results emphasize the importance and value of the economic relief provided through the CARES Act by the federal government. Without that relief, a significant number of SNFs would likely have closed. Yet, there are certainly SNFs that have either overperformed or underperformed in comparison to these averages and medians.
External market fundamentals
There are also broad market signals that help paint a picture of where the industry is trending.
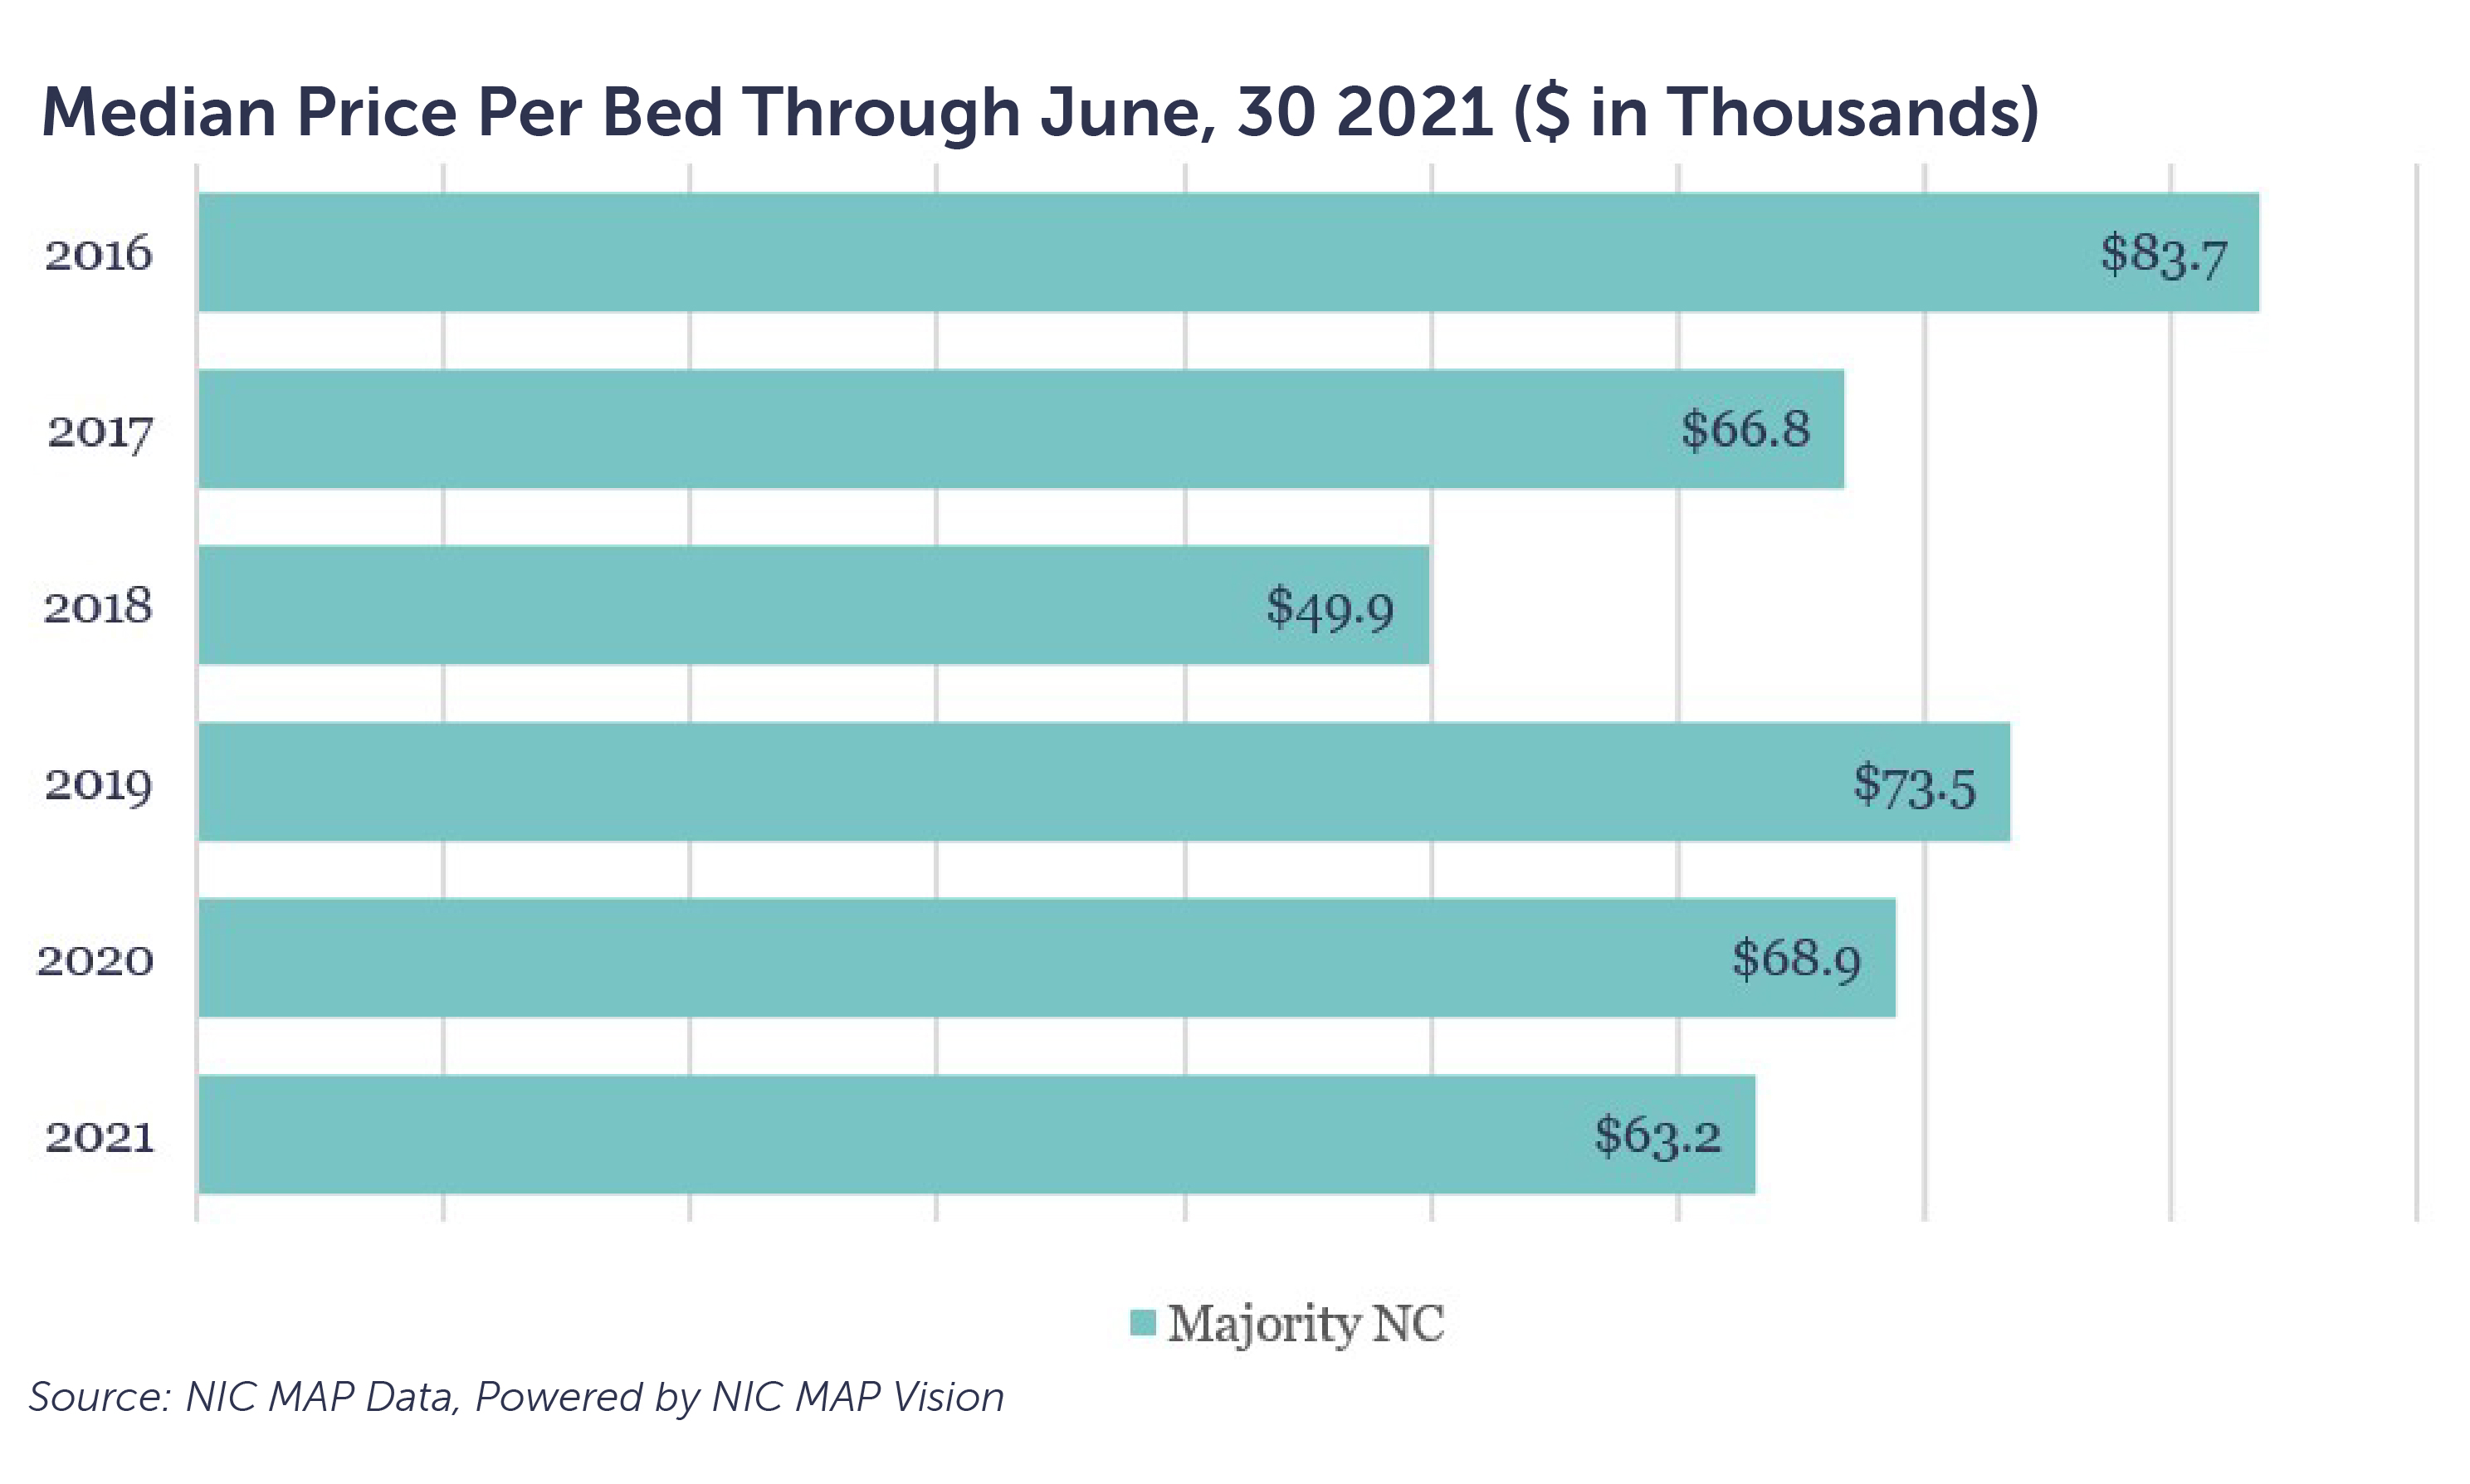
According to the NIC MAP® Data Service, the median price per bed declined approximately 6% for the period January to June 2021 and approximately 8% compared to 2020. The median price per bed for 2021 was the second lowest of the preceding five years.
Correlating bed prices with one of the key fundamental drivers of SNF operational performance — occupancy — provides further insight into the market. Among those facilities that transferred ownership between Q4 2020 and Q2 2021, their median occupancy trends deviated below national median levels, which signals that facilities experiencing operational challenges are increasingly transferring ownership.
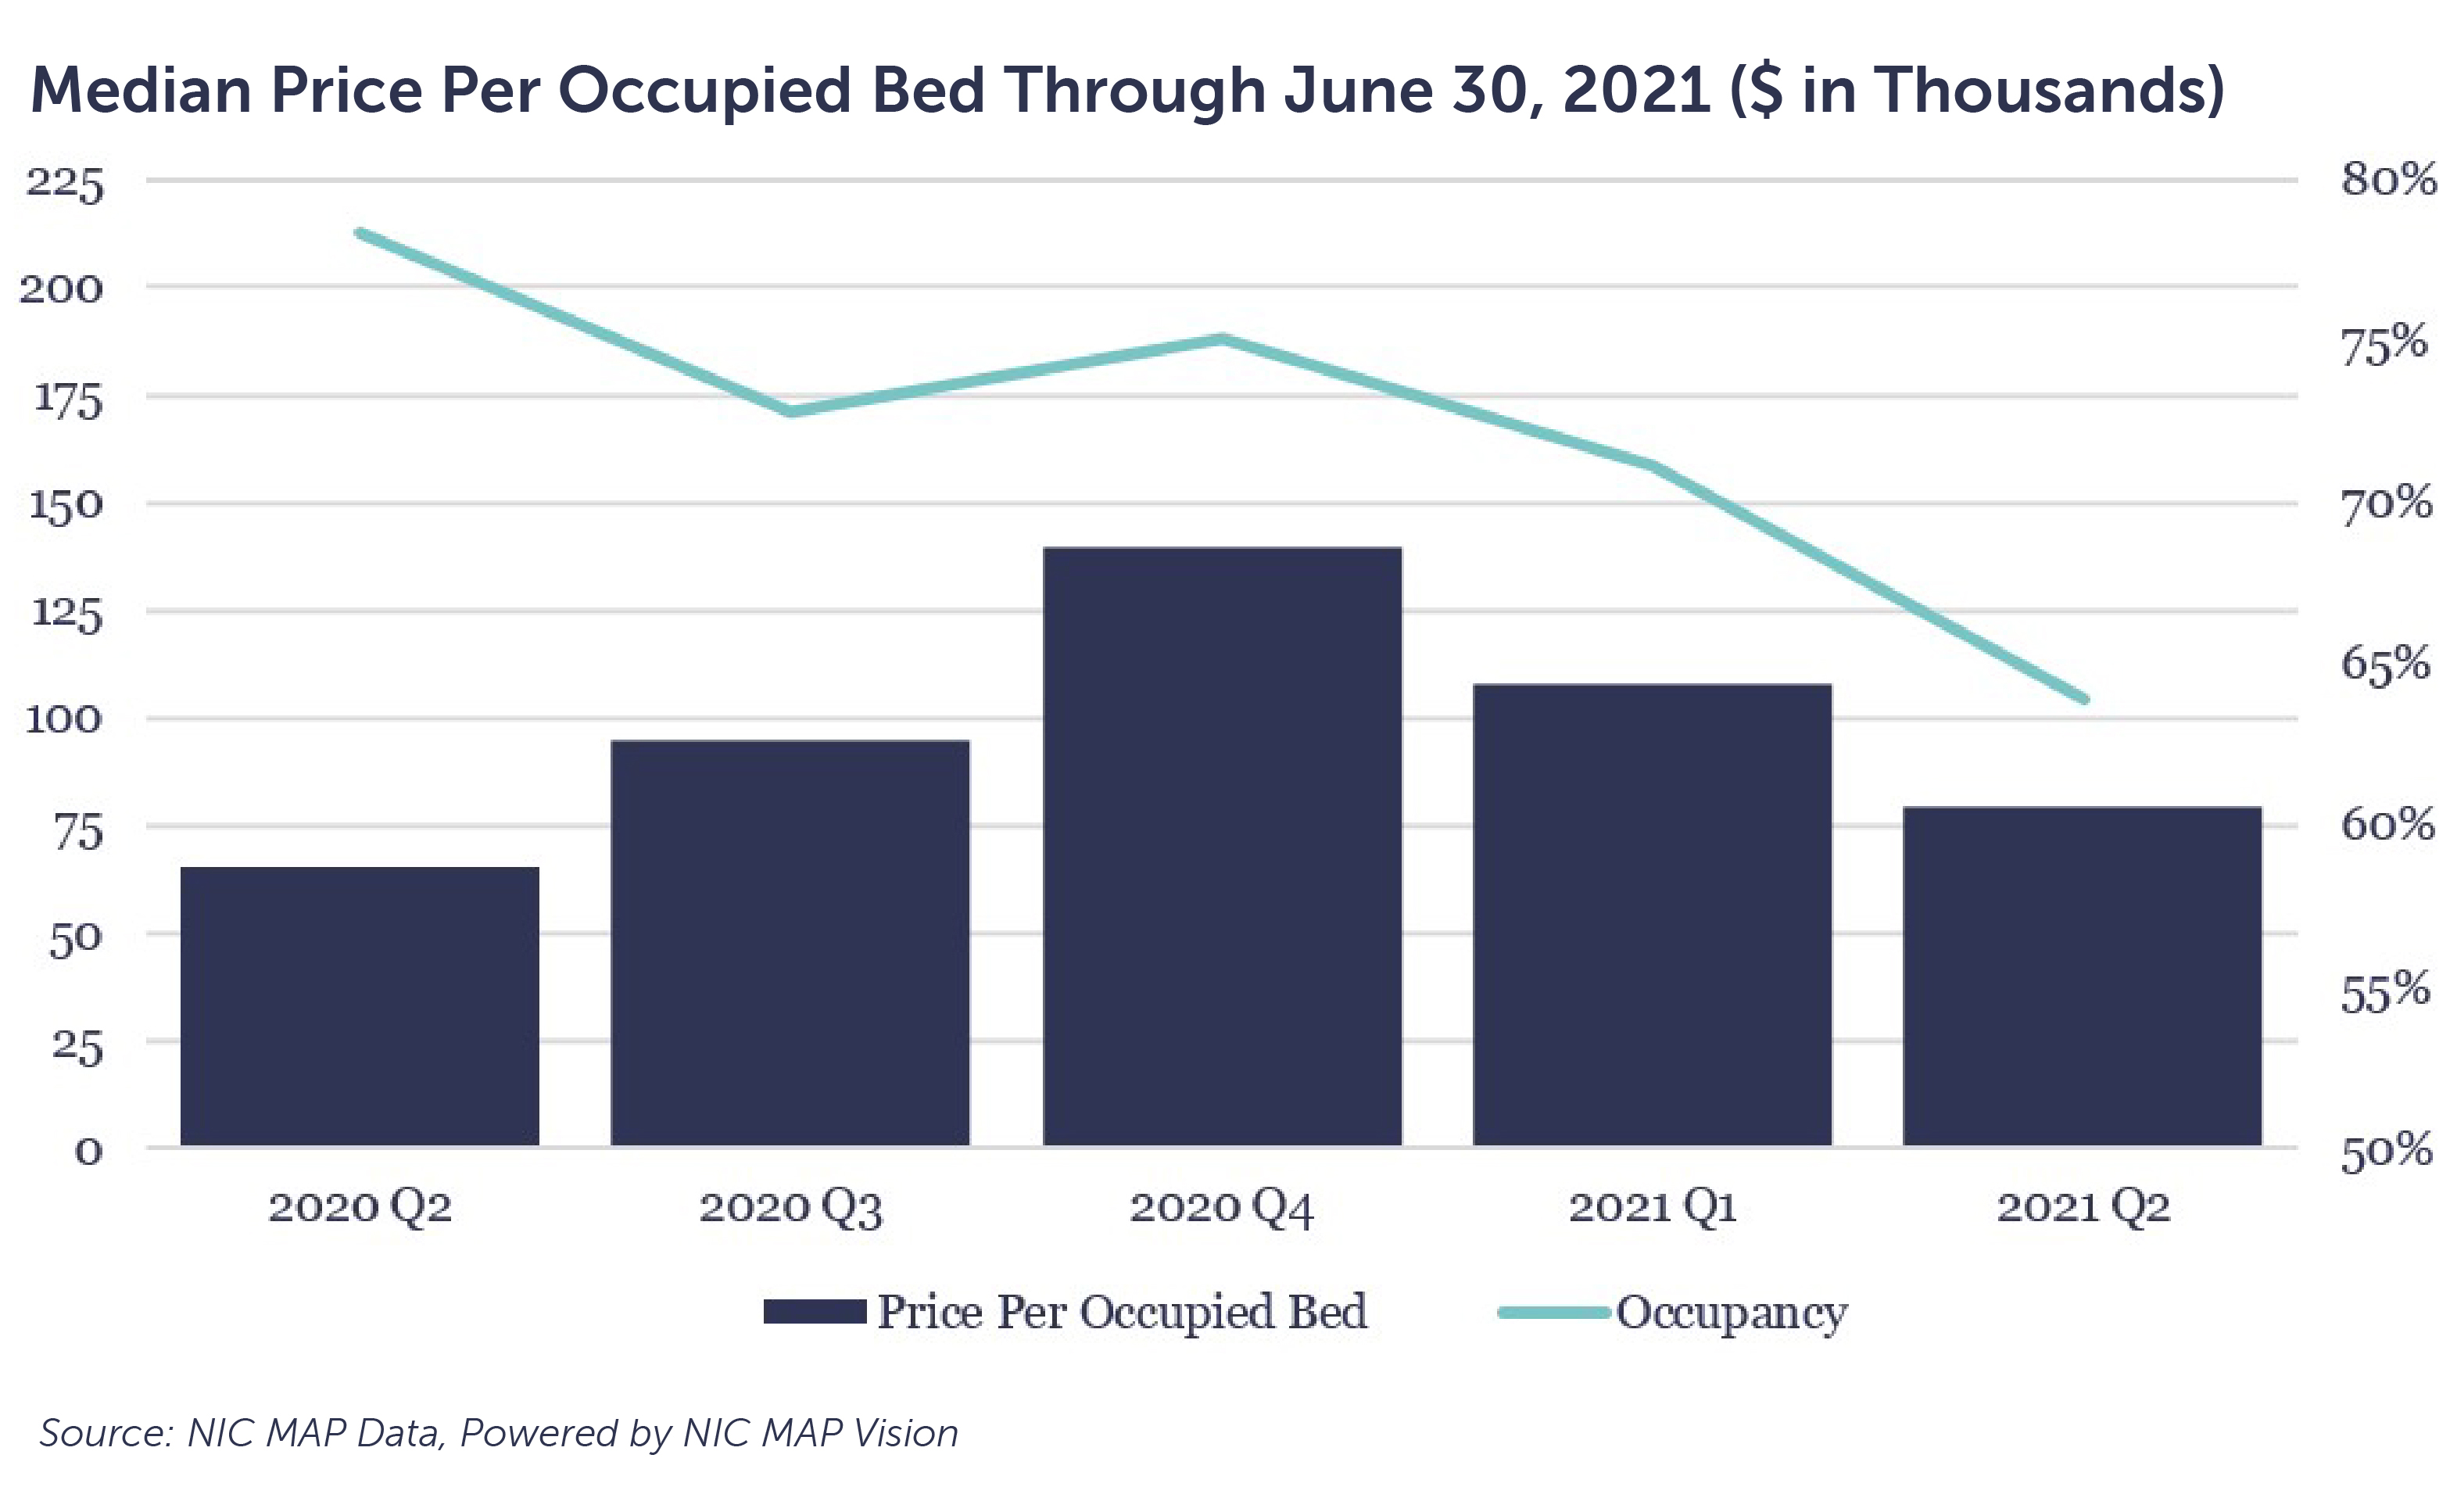
The merger and acquisition market has been increasingly active thus far in 2021, compared to pre-COVID. The volume of announced transactions in Q2 2021 was 103, compared with 94 in Q1 2020 (pre-COVID). The inverse relationship of occupancy of a transacted facility and price paid per bed, along with the increase in transaction volume, signal there is confidence in the SNF sector.
Interested in more key findings? The full report is now available. Sign up now to get your copy of the report.
How we can help
Whether you are a SNF operator, owner, or investor, you must consider what the fundamentals are signaling about operating results and the broader market. Understanding these factors can help you identify opportunities within your organization and the market and build a strategic path to a financially viable future.
CLA can help you assess your operations and implement change to compress your COVID-19 rebound or prepare for your “new normal.” Our senior living professionals have deep knowledge of the clinical, financial, and operational components of the SNF industry, including health care transaction support.