

Interventions by the Federal Reserve and the U.S. government stoked a remarkable stock market rally in Q2 of 2020. Our latest economic outlook breaks down the ...
Key insights
- Massive monetary and fiscal stimulus fueled a huge rally in risk assets in Q2.
- Economic fundamentals, such as jobs growth and consumer spending, showed marked improvement as the country partially reopened.
- Growth stocks, specifically the technology sector, continue to lead the market.
- The Fed once again lowered key policy rates to 0%, which has made it difficult for income-seeking investors.
Need help navigating the market?
The monetary and fiscal interventions the Federal Reserve (the Fed) and the U.S. government implemented in response to COVID-19 helped stoke a remarkable rally in risk assets in Q2 of 2020. U.S. large company stocks experienced an especially good run. The S&P 500’s 20.5% gain is its best quarterly return since 1998, and ended June only 8% off the all-time high of pre-COVID-19 days (February 20, 2020).
The Dow Jones Industrial Average, at +18%, had its best quarter since 1987. The technology-stocks-heavy NASDAQ composite index, meanwhile, registered its best quarter since 1999 (30.9%). Foreign stocks surged as well — both developed (+14.9%) and emerging markets (+18.1) posted a large quarterly gain (Sources: Bloomberg, Associated Press).
In the fixed income markets, bond yields traded within a fairly narrow range during the second quarter. Credit (especially corporate bonds) fared better than rates (i.e., U.S. Treasury securities). The Federal Reserve’s direct market interventions — buying bond exchange-traded funds (ETFs) and even some individual bonds — buoyed prices and appeared to restore investors’ confidence. To wit, taxable bond funds saw net inflows of $74 billion in May after a staggering $240 billion of outflows in March. The broad investment grade bond index, the Bloomberg Barclays Aggregate Index, posted a return of 2.9% for the second quarter.
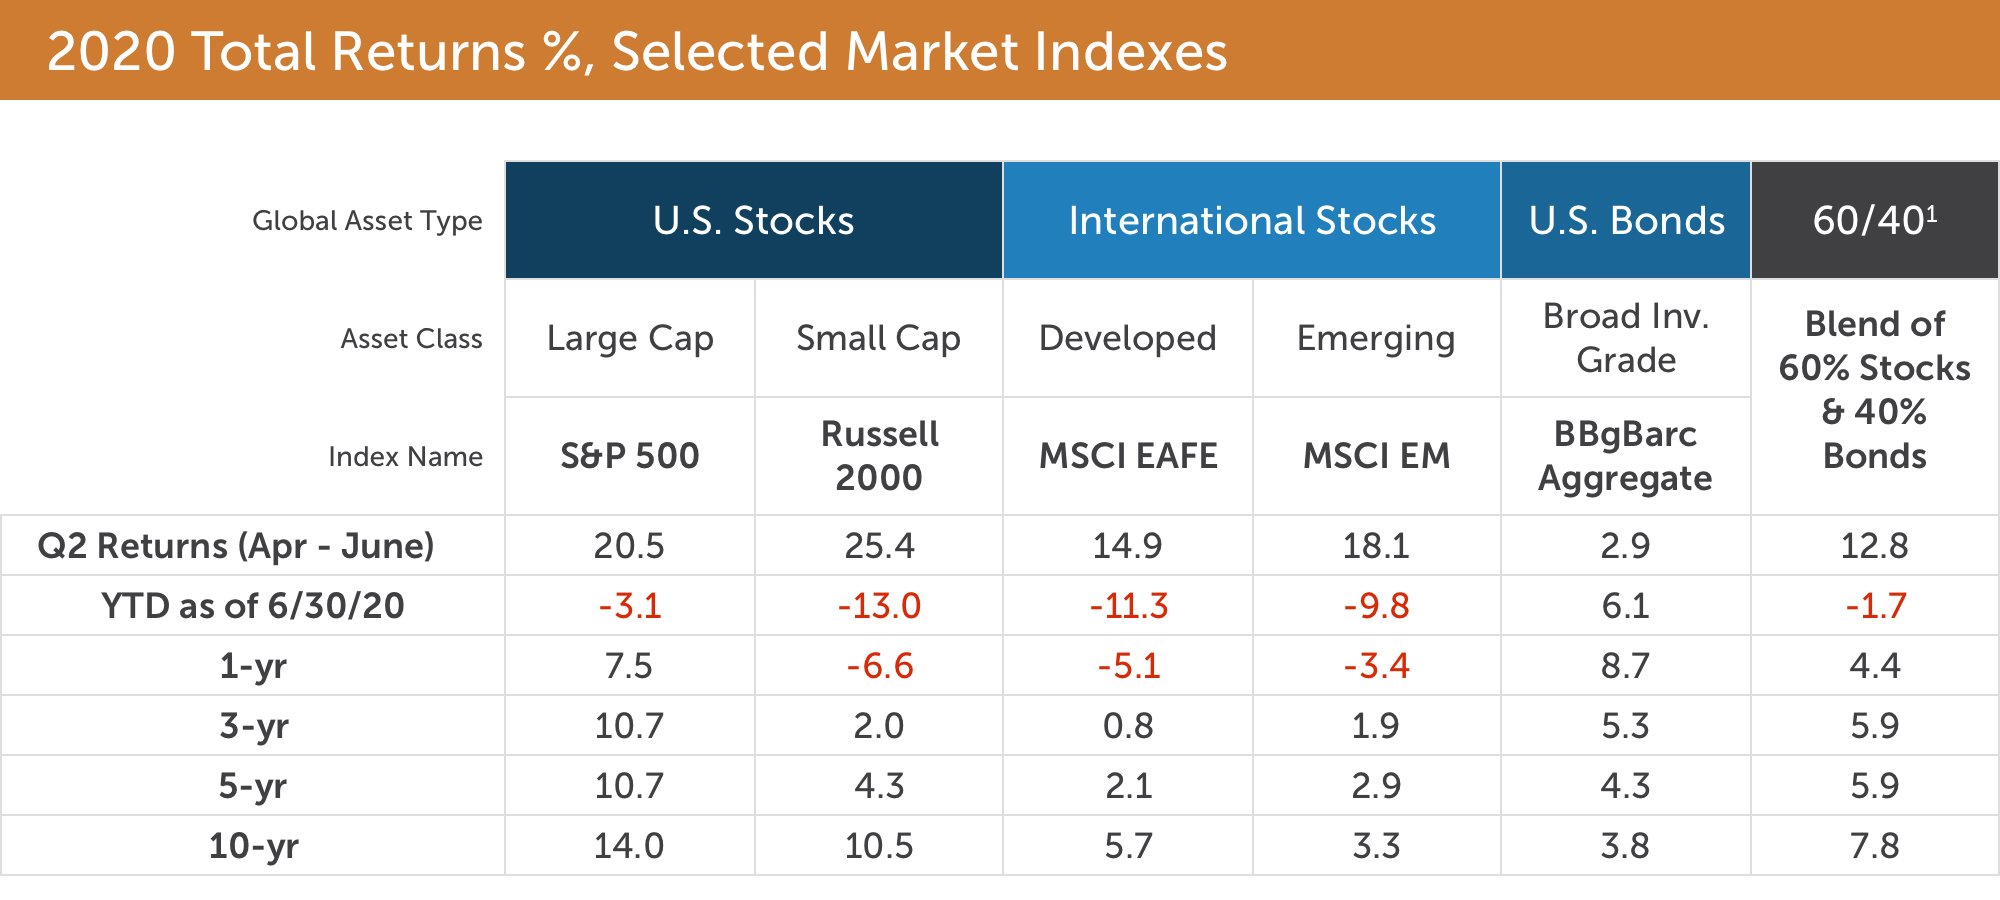
1 Hypothetical 60/40 blend comprised of: 40% BBg Barclays U.S. Aggregate, 32% S&P 500, 7% Russell 2000, 16% MSCI EAFE, and 5% MSCI EM.
An investor cannot invest directly in an index, and the hypothetical portfolio is not intended to reflect any specific portfolio managed by CLA Wealth Advisors. An unmanaged index does not reflect any expenses that may be associated with an actual portfolio.
Returns above are total returns %, annualized for periods of longer than 1-yr. Past performance is no guarantee of future results.
Source: Morningstar
Economic fundamentals begin the road to recovery
Surging stocks were not the only positive phenomenon in the second quarter. Indeed, the broad economy also took important first steps toward recovery. With the partial reopening of the economy, the jobs picture — though still gloomy — improved dramatically. The official unemployment figure, which approached 15% in April, fell to 11.1% with the June reading.
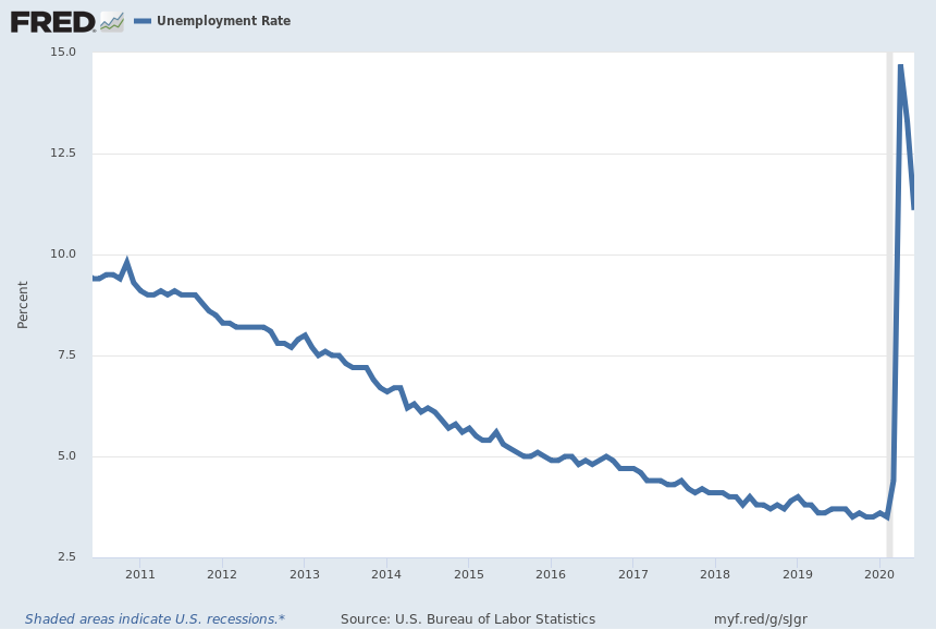
Source: U.S. Bureau of Labor Statistics
Consumption comprises nearly 70% of the U.S. economy (JPMorgan, Bureau of Economic Analysis). Retail sales, therefore, are an important measure of economic vitality. Reviewing the retail sales data underlines the remarkable speed and steepness of the COVID-19 lockdown contraction. Retail sales fell an amazing 22% in just two months, from the February 29 through April 30 reading. Compare this to the spending decline during what is called the Great Financial Crisis, when it fell “merely” -13% from November 2007 through March 2009.
The latest reading, May 2020, widely surpassed analysts’ expectations and rose +18%, month over month. (Most analysts expected an increase of only half as great, or less). This positive turn of events was spurred by fiscal stimulus (e.g., $1,200 checks) and partial economic reopening. The trajectory of consumer spending in the second half may depend on whether there is a second round of stimulus checks or renewed lockdowns due to COVID-19.
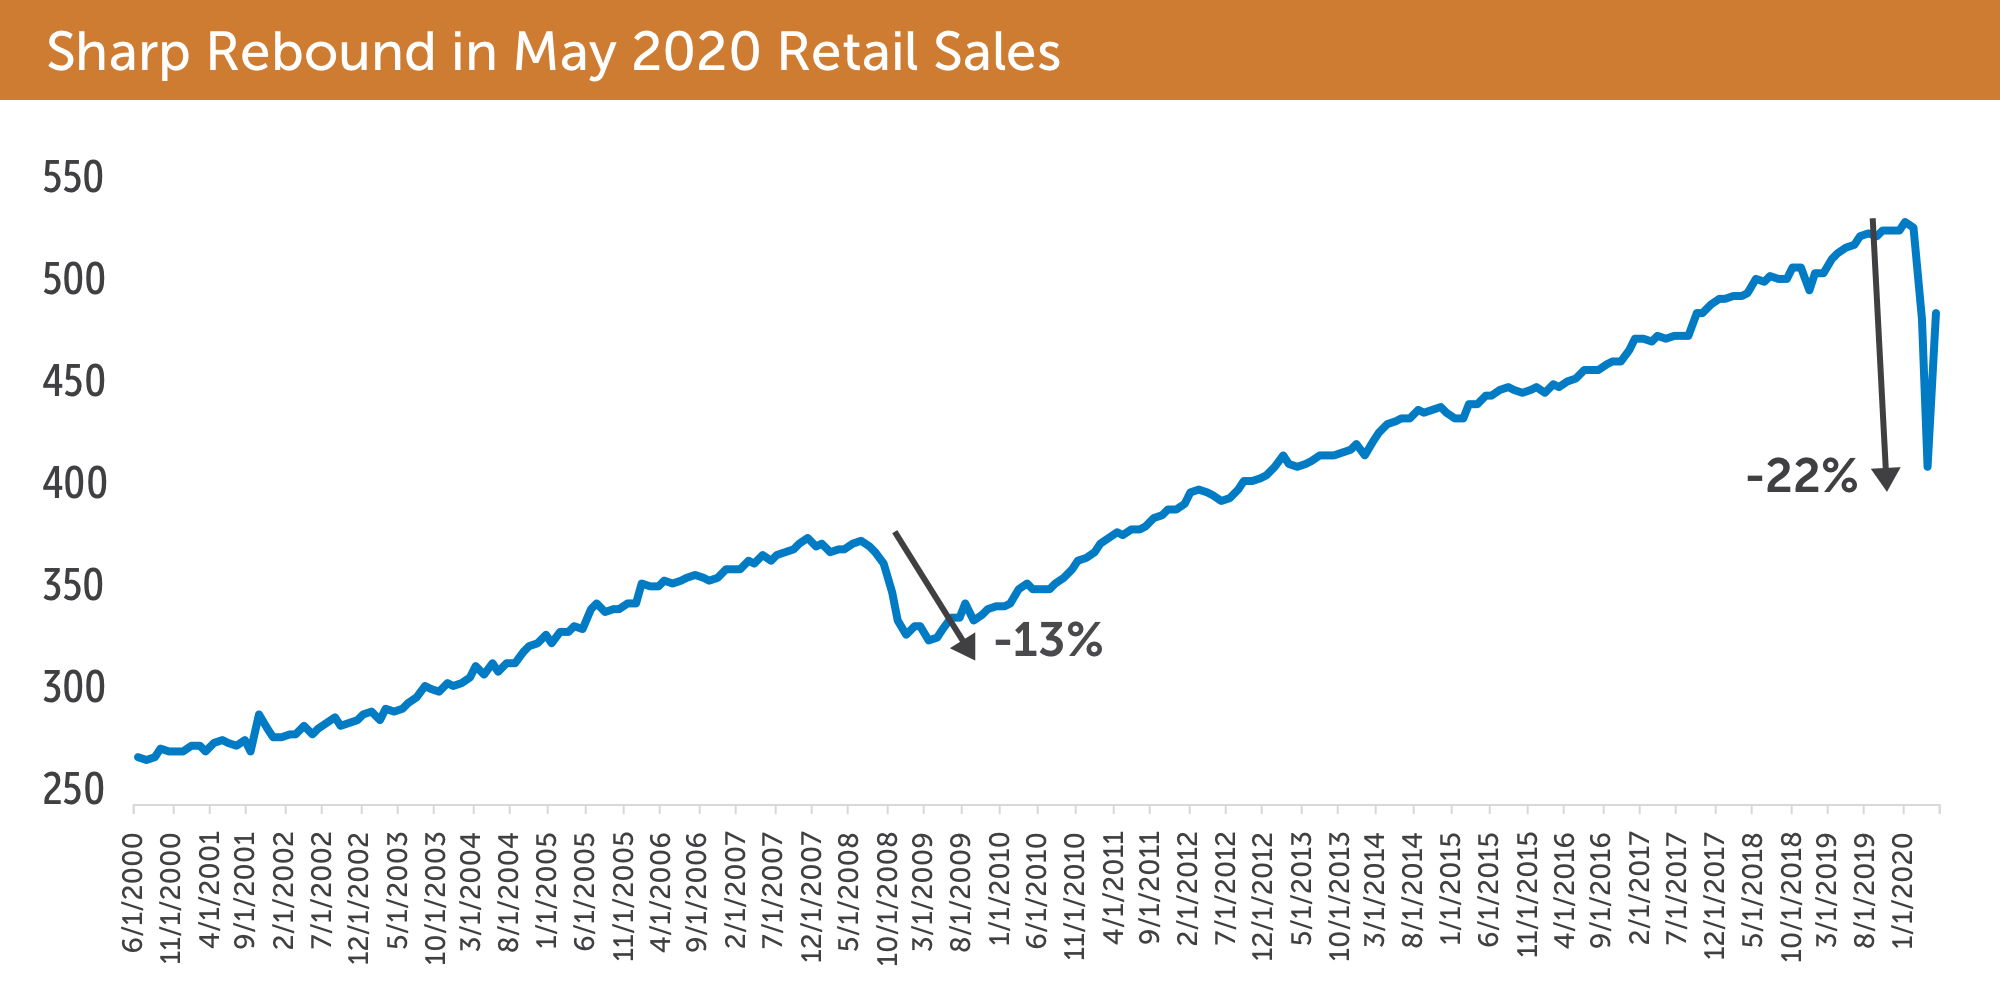
Source: Bloomberg
Another encouraging sign of economic improvement in the second quarter is seen in the manufacturing data. The Institute of Supply Management’s manufacturing gauge (PMI) surged nearly 10 points in June. Importantly, the reading is now above 50, which indicates that manufacturing is in growth mode (while sub-50 readings indicate contraction).
Respondents to the manufacturing survey were also signaling optimism — “1.3 positive comments for every one cautious comment, reversing the cautious trend which began in March” (instituteforsupplymanagement.org/ISMreport). Promisingly, the improvement in manufacturing is a global phenomenon, which includes Eurozone, China, and Asia-ex. China surveys all show dramatic improvement since April (Markit PMI, June 2020).
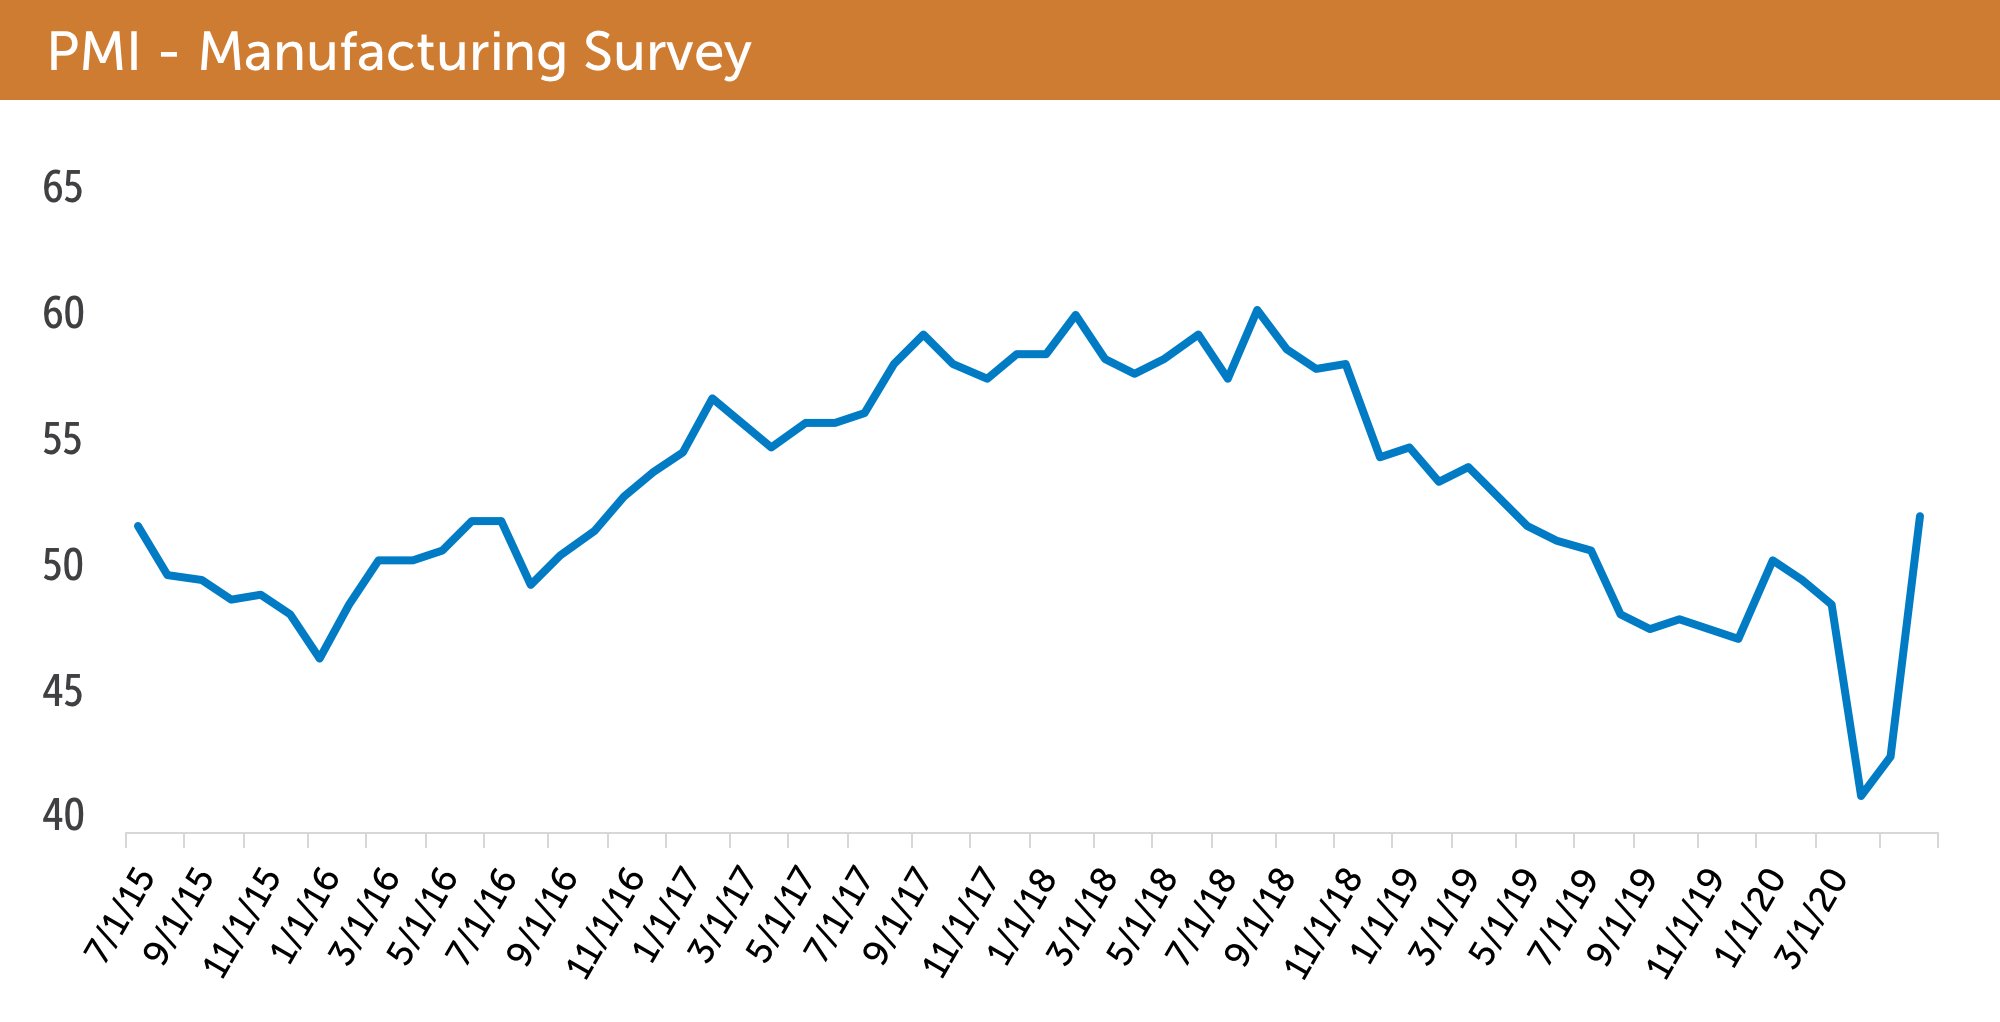
Source: Bloomberg
Technology stocks dominate the landscape
Amid all the unprecedented things happening in the markets, one feature of 2020 feels quite familiar at this point — namely, the outperformance of large cap stocks. Within the large cap universe, the technology sector dominates, comprising nearly 30% of the S&P 500 index.
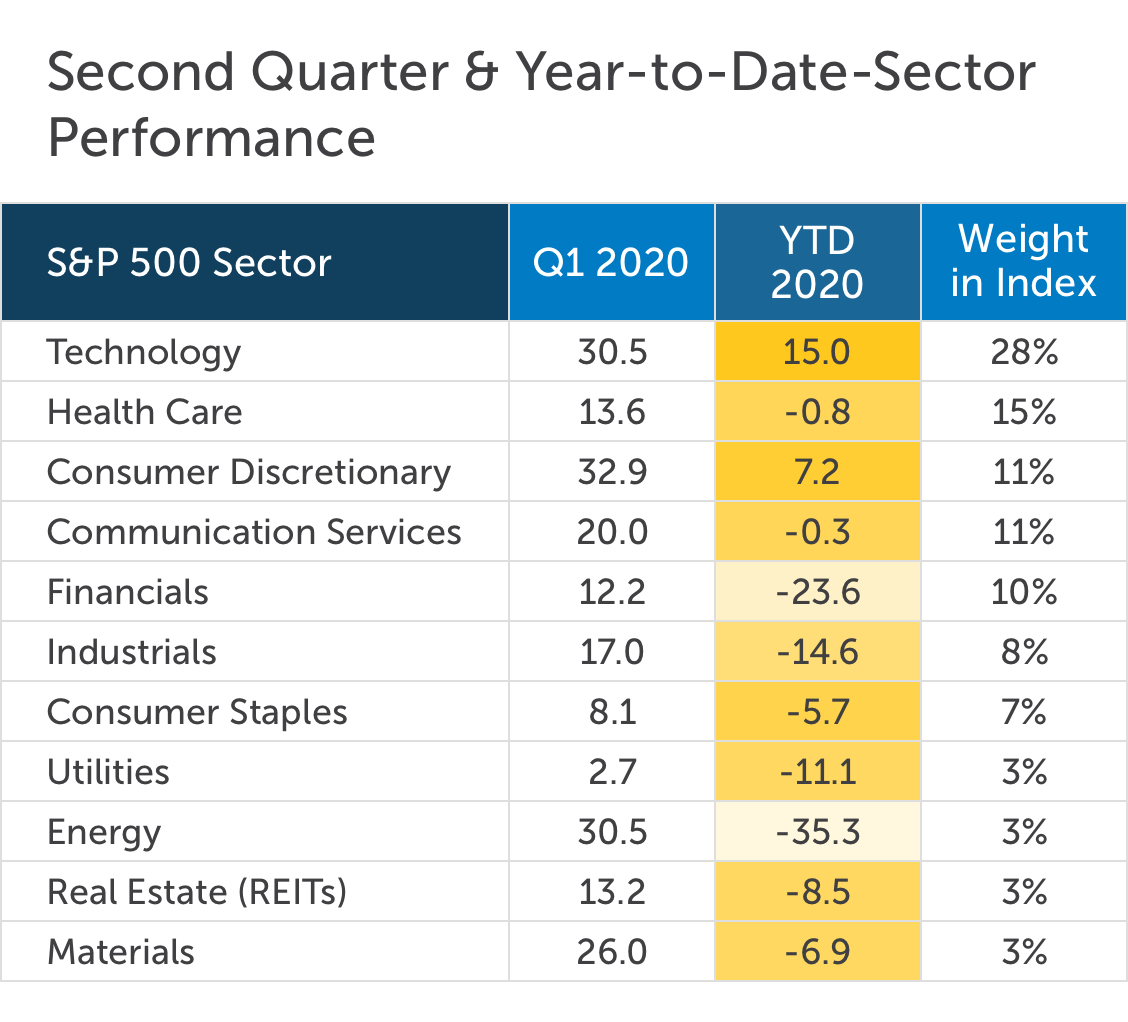
Total Returns; Sources: Standard & Poors and JPMorgan Asset Manangement
If we zoom in further still, we can observe that a small subset of technology names have exploded in value to drive the market indexes higher. One way to illustrate this is seen in the graph below. The combined value of five tech giants — Microsoft, Apple, Amazon, Alphabet (Google), and Facebook — account for more than 20% of the total value of the S&P 500.
Historically High Concentration in the S&P 500’s Biggest Stocks
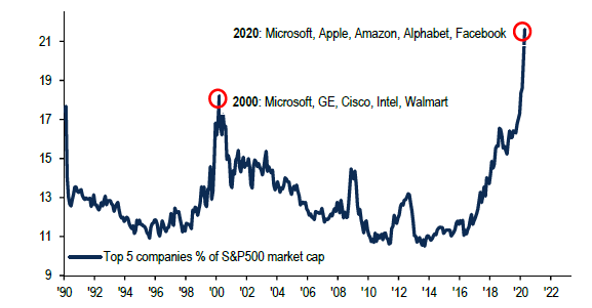
Source: BofA Global Investment Strategy, Bloomberg
Is the bull run in tech overdone? The answer is complicated and a balanced view is required. Valuation ratios of these stocks, and the broad technology sector, are somewhat rich, yet they are nowhere near Internet Bubble-era valuations. These tech giants also share enviable characteristics: strong balance sheets, robust cash flow, and wide economic and competitive “moats” (to use a term favored by analysts). They remained well-positioned to lead the market’s recovery.
Growth and earnings outlook
We anticipate that the economy will contract in 2020. A wide sampling of gross domestic product (GDP) growth estimates converge in the -5% to - 6% range for 2020. We’ve already observed significant improvement from the ultra-depressed levels of March and April, and there is hope that improvement will continue in the second half. In 2021, analysts see the economy growing once again, perhaps in the mid-single digits range for the year.
It’s no surprise that corporate earnings reports are currently gloomy. Estimates for Q2 2020 show a -48% decline in earnings-per-share for the S&P 500. Only the fourth quarter of 2008 saw a larger quarter-over-quarter decline in earnings (-69%). Companies are also hesitant to forecast how earnings may come in for the rest of the year. As of June 30, nearly 200 companies in the S&P 500 have withdrawn earnings-per-share guidance for fiscal year 2020.
Some analysts have pointed to the fact that operating leverage may add fuel to corporate profit engines as we move forward. Operating leverage essentially refers to companies that have reduced fixed expenses and positioned themselves to generate greater profits as top-line revenue grows. As the economy improves, corporations that reduced employee count and aggressively cut expenses will be running lean, which bodes well for profits.
Fed’s interest rate policy creates a yield desert for investors thirsty for income
As part of the epic policy response to the economic shock of the COVID-19 pandemic, the Fed lowered the key Fed fund rate to effectively zero in March. This action stimulates the credit markets by making the cost of borrowing low, which should have a positive effect on the broad economy. For investors who rely on income from fixed income instruments, however, this policy creates a problem. Below is a table of yields currently offered from a broad array of fixed income assets as of June 30, 2020:
| U.S. Treasuries by Maturity | Yield % |
|---|---|
| 3-month | 0.14 |
| 2-yr | 0.15 |
| 10-yr | 0.66 |
| 30-yr | 1.41 |
| Bond Indexes and Selected Sectors |
Yield % |
|---|---|
| Tax Free Money Markets1 | 0.01 |
| U.S. Aggregate Bond Index | 1.25 |
| Municipal Bond Index | 1.50 |
| Investment Grade Corporates | 2.15 |
| MBS (mortgage-backed securities) | 1.36 |
| ABS (asset-backed securities) | 3.10 |
| High Yield ("Junk") Bonds | 6.87 |
These yields are extremely low, both on an absolute basis and relative to long-run averages. (For example, the yield on investment-grade corporates, 2.15%, is the lowest ever [Bloomberg].) If investors “reach for yield” by going into riskier assets, this could prove problematic.
For example, the duration (a measure of interest rate risk in a bond investment) of the U.S. Aggregate Bond Index is approximately 5.8 years. This means that a hypothetical spike in interest rates of 1% would result in a price decline in the index of about 5.8%. It must be said that a spike in rates seems like a low probability even over the short term — but if 2020 has taught us anything, it is that anything can happen.
To seek higher yield by accepting greater credit risk — such as via the high yield bond market — comes with its own perils. The bonds of lower credit quality companies have higher default risk and are generally more volatile than the bonds of investment-grade issuers. To illustrate, the exchange traded fund that tracks the High Yield Bond Index (symbol: HYG), fell -22% from February 20 through March 23, 2020 (Bloomberg).
In summary, the zero interest rate policy environment is a challenge for investors. Weigh the trade-offs between yield and interest rate and credit risks. Generally speaking, we employ some actively managed bond funds within the fixed income sleeve of our portfolios, with the expectation that a skilled manager can help navigate the risks and find good opportunities in bonds.
How we can help
The first half of 2020 has been one of the most tumultuous epochs in modern history. In addition to chaos in the global economy and capital markets, social and political divisions have also boiled over. Although uncertainty about the future is an unavoidable fact, at times the uncertainty has felt overwhelming. How is one to cope?
From a financial and investment planning standpoint, we always return our focus — and the focus of our clients — to controlling the things we can control. Follow a thoughtful financial plan, manage spending and saving, and create a diversified portfolio resilient to shocks. We are mindful of risks, but look toward the future with optimism.
CliftonLarsonAllen Wealth Advisors, LLC
Investment Committee
The purpose of this publication is purely educational and informational. It is not intended to promote any product or service and should not be relied on for accounting, legal, tax, or investment advice. The views expressed are those of CLA Wealth Advisors. They are subject to change at any time. Past performance does not imply or guarantee future results. Investing entails risks, including possible loss of principal. Diversification cannot assure a profit or guarantee against a loss. Investing involves other forms of risk that are not described here. For that reason, you should contact an investment professional before acting on any information in this publication. Financial information is from third party sources. Such information is believed to be reliable but is not verified or guaranteed. Performances from any indices in this report are presented without factoring fees or charges, and are provided for reference and competitive purposes only. Any fees, charges, or holdings different than the indices will effect individual results. Indexes are unmanaged; one cannot invest directly into an index. Investment advisory services are offered through CliftonLarsonAllen Wealth Advisors, LLC, an SEC-registered investment advisor. Prior approval is required for further distribution of this material.