
If you had the option to: A. Run a trial balance 24 times for each of your locations (all those clicks will surely lead to piano fingers). Or B.
Sacrifice t...
If you had the option to:
- Run a trial balance 24 times for each of your locations (all those clicks will surely lead to piano fingers)
- Sacrifice the piano fingers to run a single report, with each of the 24 periods as columns
Which would you choose?
I will understand if the answer is A as long as we all get to enjoy your piano playing in a nearby airport lounge.
This report can be built in less time than it will take to run the trial balance 24 times, and has been requested several times. So without further sarcastic commentary, let’s get to it.
It always starts with account groups
- Go To: Reports > Setup tab > Account Groups
- Add three account groups:

The TB-Accounts group should look like the below screenshot:
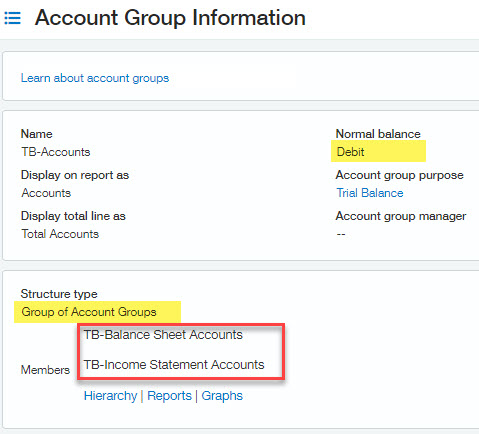
This account group serves the purpose of checking that all accounts are truly included. In the report, if no accounts have been left out, the total line will show as zero.
The TB-Balance Sheet Accounts group should look like:
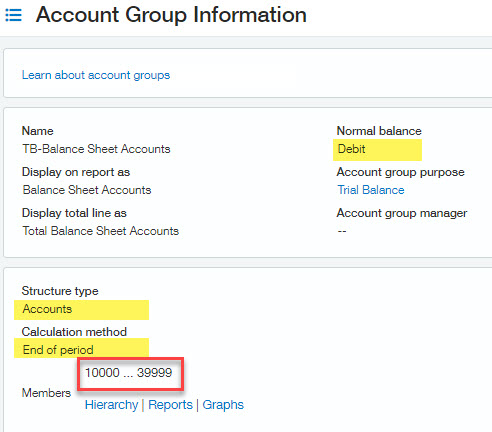
This account group assumes your balance sheet accounts are in the range 10000 through 39999. If that is not the case, update accordingly to include assets, liabilities, and net income accounts. Also note the calculation method of End of Period for this group.
Lastly, the TB-Income Statement Accounts group:
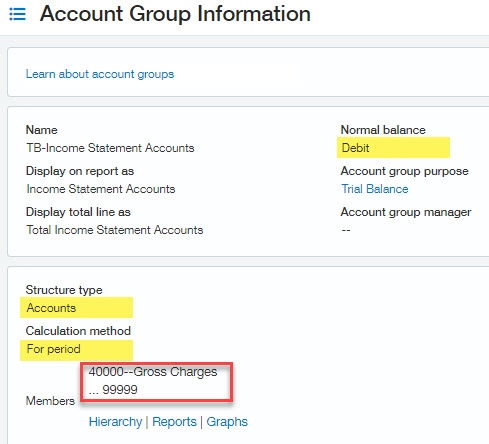
This account group also makes assumptions that you have income statement accounts in the range of 40000 through 99999. Note the calculation method of For Period here.
We had to buld the anticipation for building the report
- Go To: Reports > All Tab > + Financial reports
- Name your report and leave the structure as “accounts”
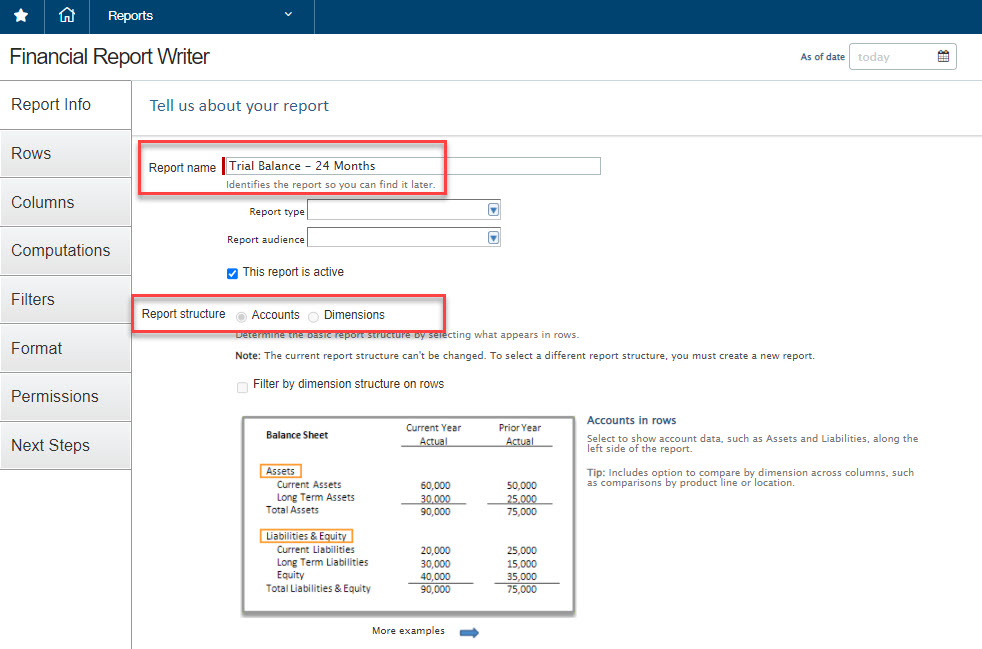
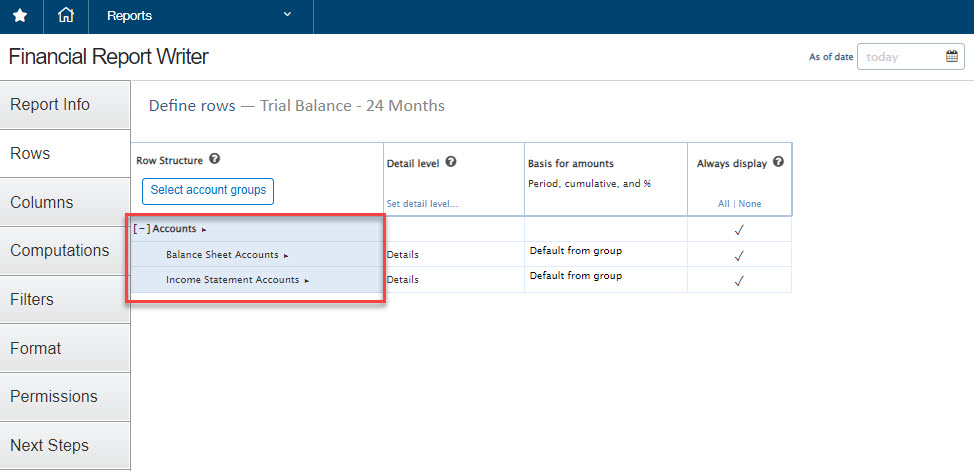
- On the Rows tab, add the TB-Accounts account group.
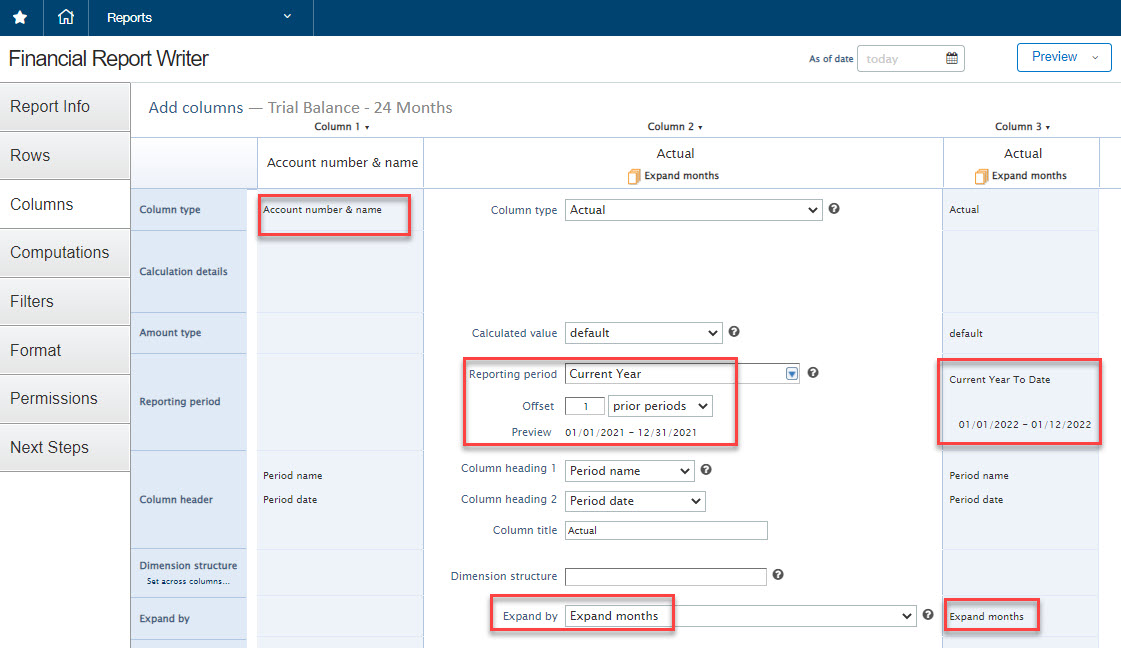
- On the Columns tab, update the first column to be Account number & name
- On the same Columns tab, add 2 columns: Current Year to Date and Current Year (1 prior period)
- Lastly, on the this Columns tab, expand each of the 2 period columns by month
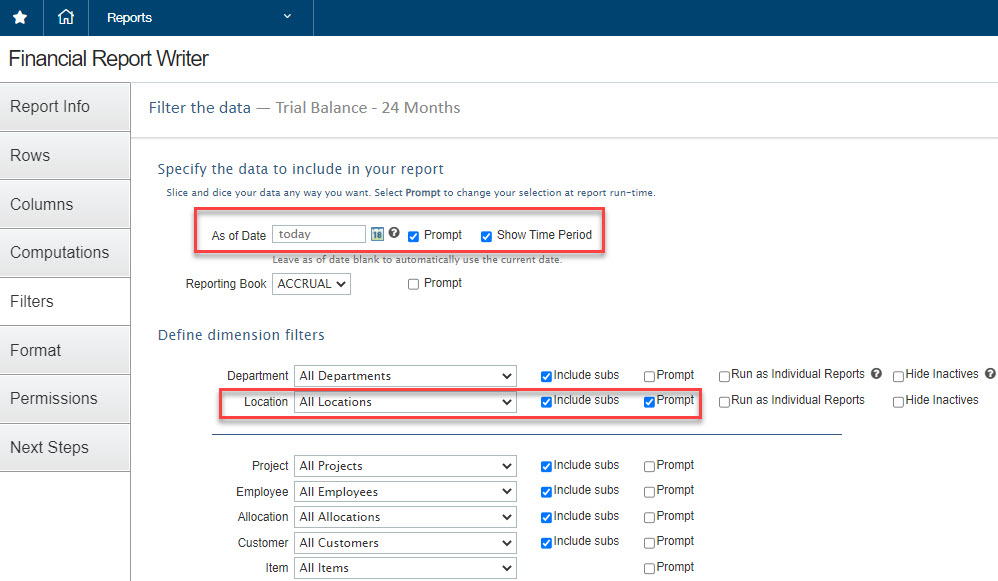
- On the Filters tab, select the prompt checkbox next to date and location
- Save!
View the report
Click the preview button to view the report, export to Excel, and grieve your piano fingers.
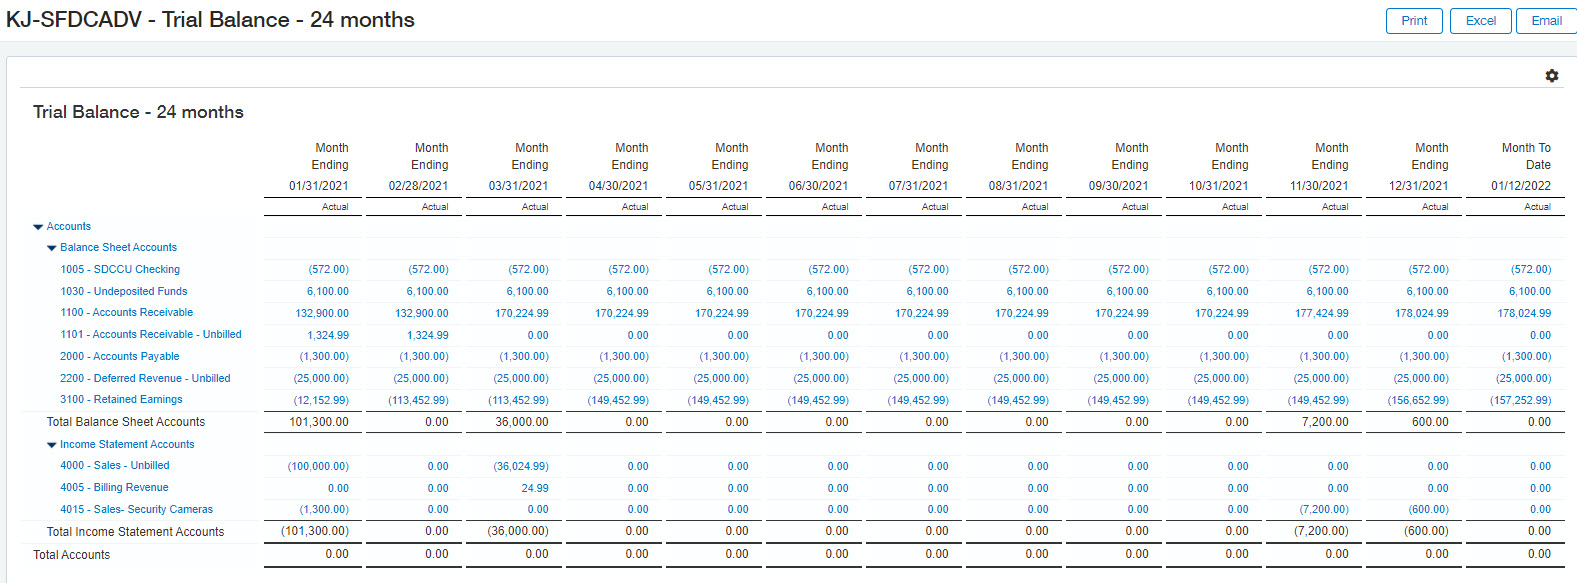
The above only contains 13 months, but only because it was the most blog-friendly view.
What’s Next?
Haven’t signed up for the complimentary Intacct webinars for 2022? There’s still time, the first will cover dashboards on January 25th and the second will cover the financial report writer on February 22nd.
Have reports you wish were possible out of Intacct, or maybe reports that just don’t work, please reach out!
The post 24-Month Trial Balance in One Click appeared first on Sage Blog.
