

How does your organization compare to competitors? CLA surveyed 229 general building contractors throughout the United States to help you understand your performance...
General building contractors face daily challenges, both operationally and financially. They need to know how their company stacks up against their competition and if there is anything they can do better to improve their operating results.
CLA’s industry professionals have compiled data from privately held general building construction companies to create an annual benchmark report that provides analysis of critical ratios and national trends.
Download the broader construction industry benchmarking report.
The 2018 General Building Construction Benchmark Report summarizes data from 229 general building contractors from across the United States. This report offers key financial and non-financial information to assist general building contractors in comparing themselves to their peers. Contractors included in the survey are engaged in general building residential homes, commercial buildings, condominiums, multifamily housing, hospitality and gaming facilities, airports, industrial facilities, parking garages, and renewable energy projects.
Overview and Executive Summary
Industry challenges and opportunities
Across the general building industry, gross margins (as of percentage of revenue) decreased from 11.1 percent in 2016 to 10.1 percent in 2017, but overall profitability (operating income as a percentage of revenue) remained at approximately 3 percent. General building contractors were also able to maintain strong balance sheets while keeping margins consistent.
General building contractors face several challenges in 2018.
- Many are facing an aging workforce at higher levels of management without a succession plan. In addition, companies have had to raise labor costs to attract and retain talent, as the construction industry faces labor shortages across the country. High demand for qualified labor and project managers makes it difficult to attract and retain employees.
- Cybercriminals continue to target small- and medium-size businesses through ransomware and online banking attacks. Ongoing security and maintenance are imperative to prevent cyberattacks.
- Recent natural disasters will further impact the construction labor market and put upward pressures on material prices.
- Tariff activity from the current administration has led to more volatility in supply prices, particularly from foreign suppliers. This has caused cost forecasting to be increasingly difficult with lumber and steel prices changing significantly after bids have gone out.
- The recent tax reform presents opportunities for contractors to re-evaluate their organizational structure, capitalize on incentives for re-investment in their businesses, and update their employee reward programs.
Key ratios and trends
Margin on self-performed work ― More general building contractors are self-performing specialty work such as concrete and electrical, reducing the number of subcontractors and increasing margins. Overall margins on this work have increased from 25.1 percent in 2016 to 28.3 percent in 2017. For general building contractors with revenues greater than $50 million, the margins increased from 24.4 percent to 29.5 percent. Margins for contractors less than $50 million have increased from 25.9 percent to 27.7 percent.
Although self-performed work is profitable, general building contractors need to be careful that they have the expertise necessary to perform this work. The increase in margins over time suggests that contractors are increasing their efficiencies and expertise, but be mindful of potential warranty work in the future.
Working capital turnover ― Working capital turnover for all general building contractors in the benchmark study increased from 12.2 in 2016 to 13.3 in 2017. Contractors with revenues greater than $50 million had a much higher working capital turnover in 2016 and 2017 (19.9 and 23.1, respectively). Larger companies are clearly able to more effectively use working capital to generate revenue.
Days in accounts receivable ― Days in accounts receivable, or the number of days it takes to collect accounts receivable, are on the rise. Cash collection is of upmost importance in a business that relies on its ability to pay employees and suppliers to keep projects moving forward. For general building contractors, days in accounts receivable have increased from 46.7 days in 2016 to 49.2 days in 2017. The number of days in accounts receivable is significantly less for contractors with revenues less than $50 million, with averages of 45.0 and 47.8 days in 2016 and 2017, respectively. Contractors with revenues greater than $50 million averaged 55.2 and 54.3 days in 2016 and 2017, respectively.
Months in backlog ― As more active jobs are circulating, months in backlog increased from 4.3 months to 5.9 months between 2016 and 2017. The increase is substantially larger for general building contractors with revenues greater than $50 million, which rose from 6.2 months to 8.0 months between 2016 and 2017. This is consistent with other sub-industries, such as civil and HVAC, which indicates plenty of work for years to come.
Report methodology
Financial ratios and key performance indicators have been computed using information obtained primarily from audited and reviewed financial statements of our construction contractor clients. Participation in the study is voluntary, and data gathered have been analyzed by representatives from our construction industry practice. This report summarizes data from 229 general building contractors with operations conducted throughout the United States.
Financial ratios and key performance indicators
Analysis of financial ratios and key performance indicators can assist in the assessment of a contractor’s financial health, operating efficiency, and profitability. A critical element in the review of a contractor’s financial well-being is understanding the magnitude of a variance compared to similar organizations, and then taking the initiative to investigate and understand the reason for the variance. Ultimately, understanding the cause of variances may lead to a series of operational changes that may both improve profitability and create efficiencies.
Consistently monitoring key financial and operational indicators can help management improve profitability and operations, and provide information for developing competitive bids and maintaining healthy financial statements for bonding. Some of the advantages and limitations of using comparative indicators are outlined below.
Advantages
- Benchmarks provide comparisons to contractors with similar operations.
- The data help identify unusual operating results and trends.
- Performance indicators highlight areas of potential opportunities or challenges.
Limitations
- Variances alone do not necessarily reflect an opportunity or a challenge. Potential for inconsistency in data collection can reduce the usefulness of comparisons.
- Benchmarks should be used in conjunction with other analyses of a contractor’s operations.
- In a highly specialized market segment, companies may face a broad spectrum of competition.
Ultimately, no single ratio or financial analysis should be evaluated on its own to assess a contractor’s financial condition. Variances from benchmarks should be investigated and considered in the context of the company’s specific operating structure, sub-industry, and the region in which it operates. In many cases, the most useful information is a combination of benchmarking data and the company’s own numbers.
General Building Contractors’ To-Do List
- Assess your company’s information technology system’s vulnerability to worldwide hacking threats, and invest in information security solutions and employee awareness programs.
- Discuss the new revenue recognition and lease standards with your CPA, and meet with your financial institution and bonding agents to understand their impact on financial covenants.
- Become the employer of choice and develop strategies to open the pipeline of future laborers for your company.
- Consult with your tax advisor to review the Tax Cuts and Jobs Act to understand the impact on your company regarding tax incentives for general building contractors (research and development credits, the work opportunity tax credit, fuel tax credits, and energy efficiency incentives).
- Review your tax accounting methods for optimization.
- Start gathering and summarizing lease agreements for the upcoming implementation of the new lease standard in 2020 for calendar year-end companies.
- Dedicate resources to equipment and fleet management to better understand your equipment needs and maximize the utilization of your fleet.
Ratio analysis and key performance indicators
The following graphs present median results for each key performance indicator (KPI). The median values for each KPI were computed independently and represent the mid-point of the data set. Since median calculations are being used, mathematical relationships do not exist between the various KPIs reported.
Return on equity

This ratio represents the owners’ return on investment and can be skewed based upon the amount of discretionary expenses a company provides employees. Contractors with revenue of more than $50 million tend to have higher return on equity than other general building segments between 2015 and 2017.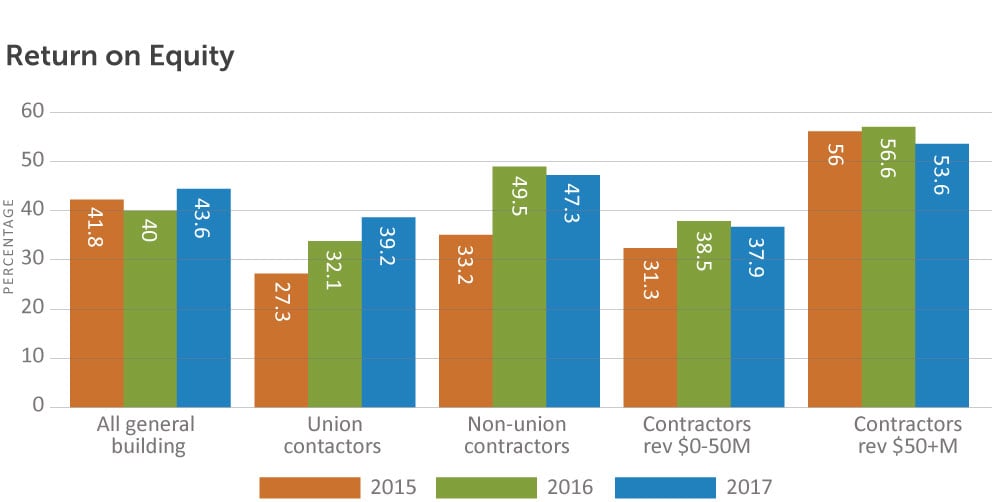
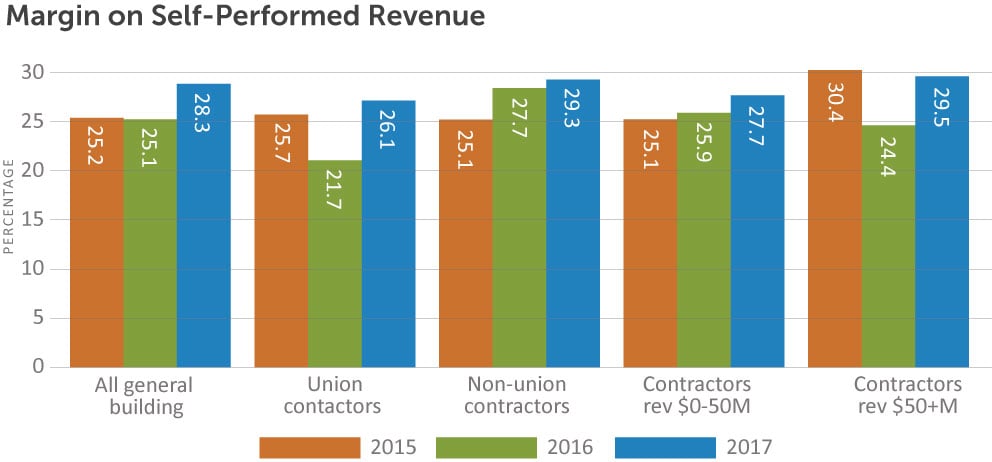
Margin on self-performed revenue

This ratio represents the percent of self-performed contract revenue the company retains after incurring direct costs associated with completing the contract.
Subcontractor expenses for electrical and mechanical contractors can be a significant portion of the overall cost associated with a project. Often, subcontracted work yields little or no profit margin to the prime contractor and can result in total gross profit percentages becoming skewed based on the amount of work a company subcontracts to others. Analyzing a company’s margin on self-performed revenue often provides a better indication of the company’s ability to generate profit on the work it performs.
Most industry segments had a higher margin on self-performed work compared to 2015. The only segments that saw decreases in this ratio between 2015 and 2017 were general building contractors over $50 million and union contractors. Margins on self-performed work are significantly higher for general building contractors than the overall gross margins.
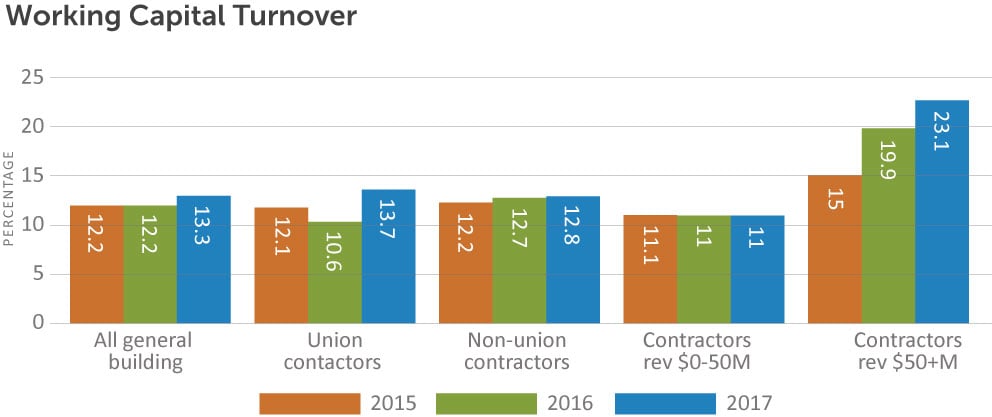
Working capital turnover

Working capital turnover indicates the amount of construction revenue generated by each dollar of working capital. The higher the ratio, the more efficient a company is in using working capital to generate revenue. However, very high working capital turnover (more than 35) can indicate the need for additional working capital to support revenue goals.
Working capital turnover varied throughout the industry segments; however, the larger, more established general building contractors with revenues over $50 million have consistently produced a higher ratio. And whereas the working capital turnover has remained steady for most segments since 2015, contractors with more than $50 million in revenue have improved.
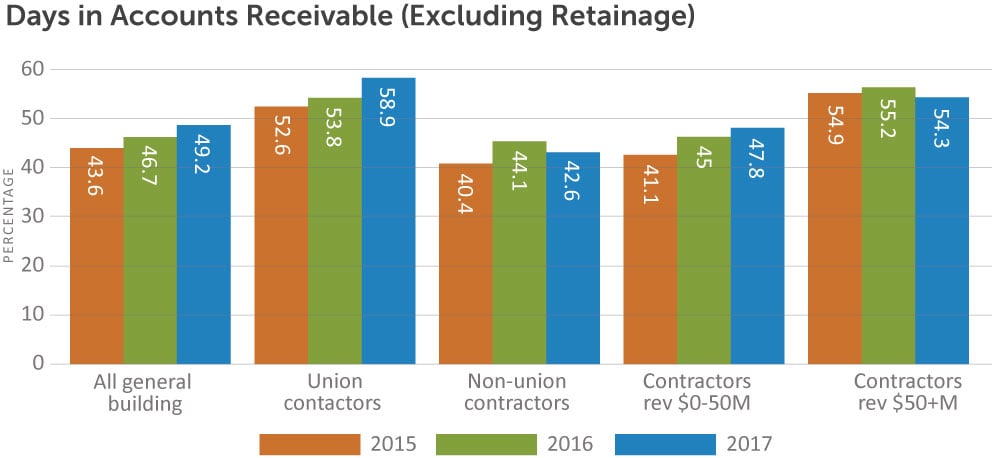
Days in accounts receivable

Days in accounts receivable (AR) calculates the average number of days that receivables are outstanding or how quickly a contractor converts its receivables to cash. Fewer days in accounts receivable is desirable, as this suggests a company takes less time to covert its receivables to cash.
Overall, it is taking general building contractors longer to collect on their receivables than it did in 2015. Union contractors and contractors with revenue greater than $50 million consistently take longer to collect receivables than nonunion and smaller contractors with revenues less than $50 million.
Balance sheet compositions
The following graphs are the weighted average composition of the balance sheets and income statements of all the survey participants. This information can help assess a contractor’s overall financial position and results of operations in relation to its peers.
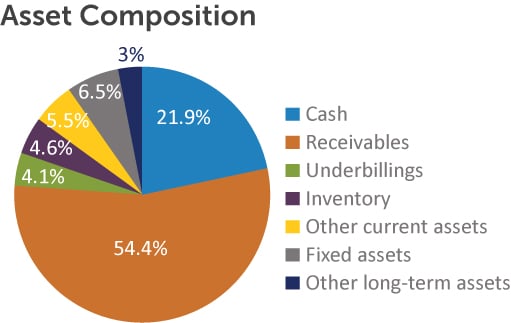
Asset compositions
The asset composition of general building contractors did not change significantly compared to 2015 and 2016. Receivables and cash make up the majority of total assets for general building contractors. Inventory and fixed assets do not make up a significant percentage due to the use of subcontractors. Also note that a company’s asset composition may differ due to location and seasonality. Typically, seasonal contractors in the northern United States see a higher percentage of cash and lower percentage of receivables due to a few months with minimal billings.
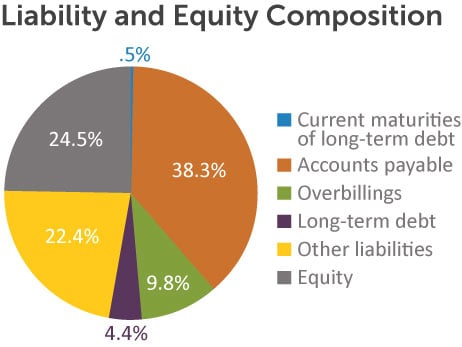
Liability and equity compositions
Similar to the asset composition, the composition of liabilities and equity has not significantly changed since 2015. The largest percentage of liabilities and equity consists of payables, which is consistent with the large percentage of receivables. The level of long-term debt is low due to less need for general building contractors to finance equipment purchases. The level of overbillings is greater than the level of underbillings in the asset composition, which means companies are able to secure favorable billing terms in their contracts.
Overall, general building contractors continue to report healthy net worth, with equity approximately 25 percent of total liabilities and equity, to finance operations and support bonding capacity.
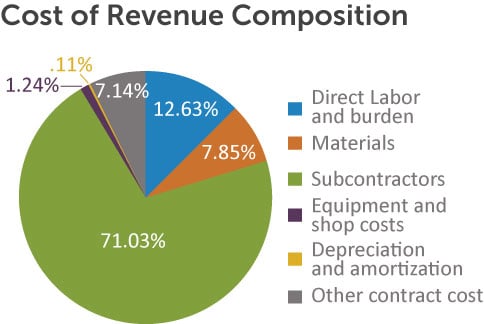
Income statement compositions
This chart shows the weighted average composition of direct contract costs compared to total revenue for general building contractors for 2017. These comparisons vary depending on the nature of the projects, status of projects at the end of the reporting period, and whether a company self-performs or subcontracts work. Therefore, the composition for a particular general building contractor will depend on operating capabilities, strategies, and the nature of the projects under contract during the reporting period.
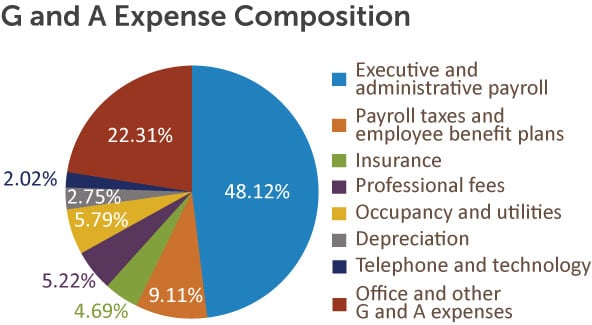
This chart shows the weighted average composition of general and administrative (G and A) expenses compared to total revenue for general building contractors for 2017. These comparisons may differ depending upon a variety of factors, including the company’s size, complexity, corporate structure, and culture. A related performance indicator is a company’s general and administrative expenses as a percentage of its revenues. This provides a gauge of overall overhead expenses relative to how well those costs are generating revenues. This can offer insight into a company’s cost structure compared to its peers.
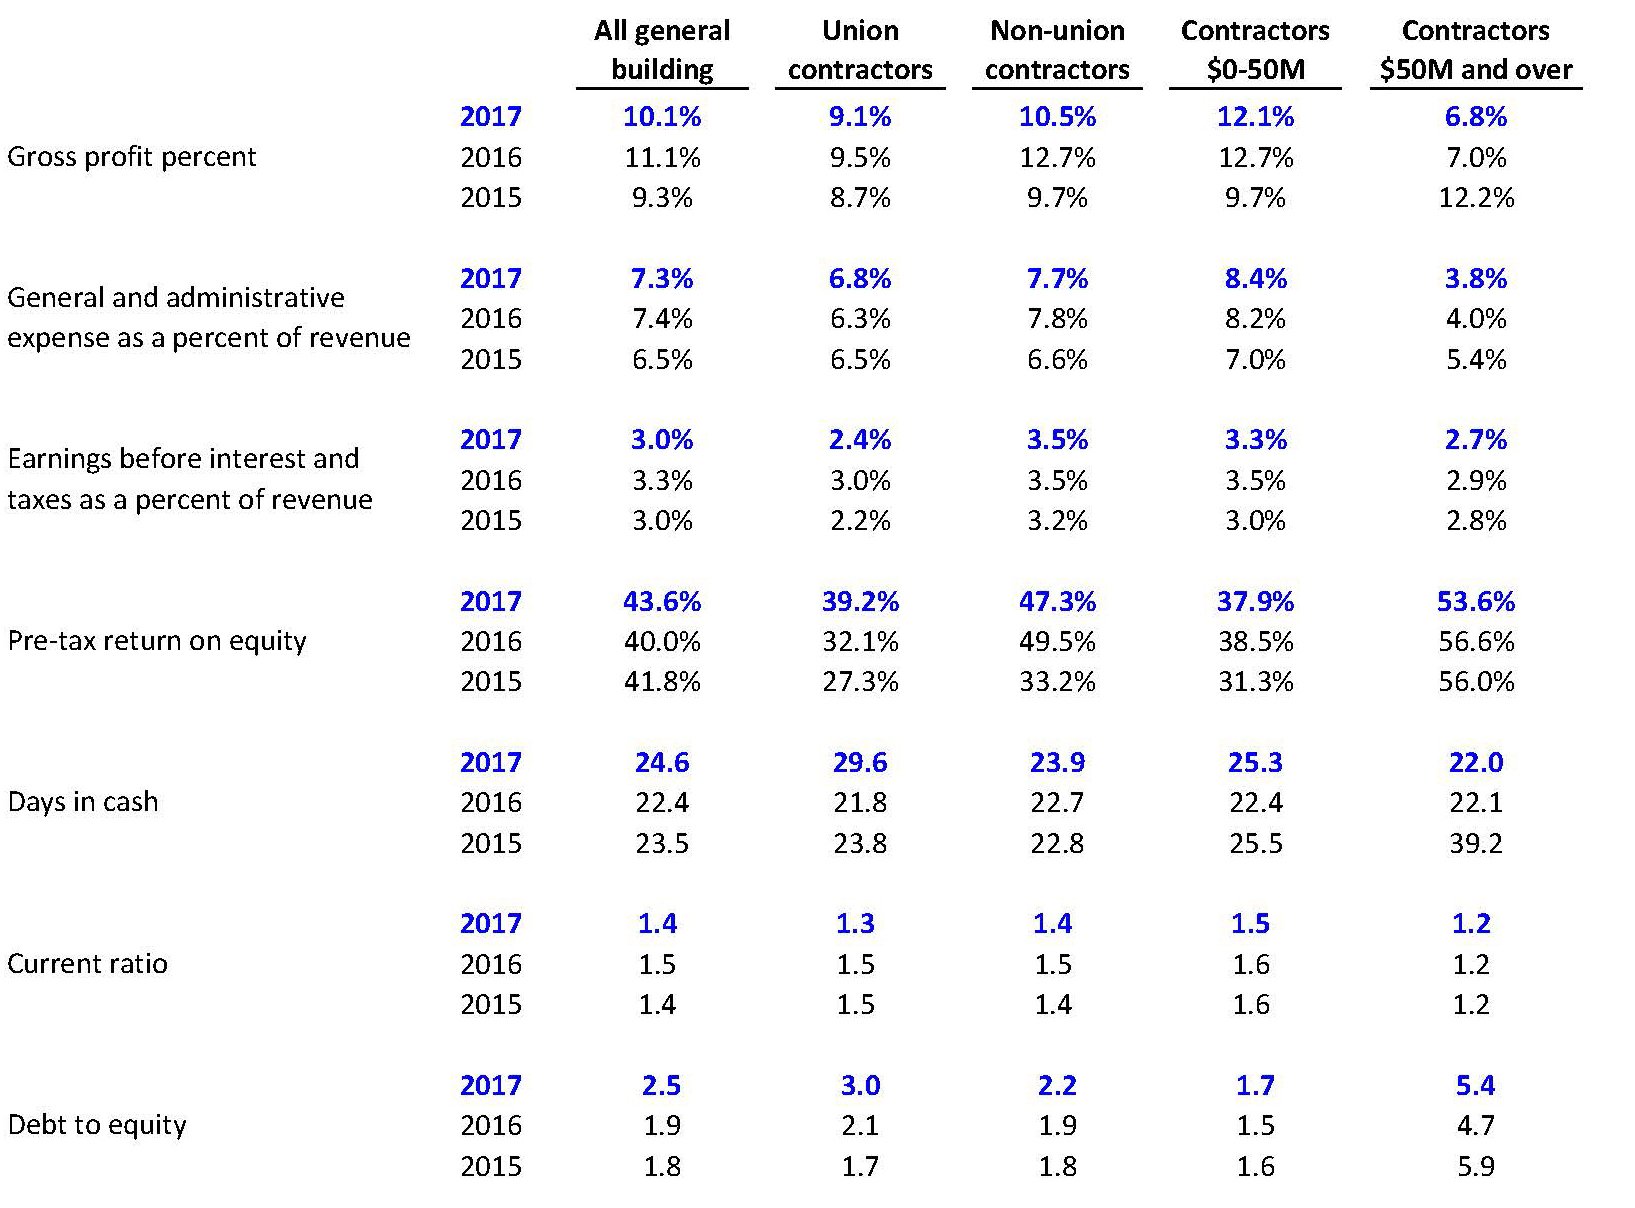
Additional key performance indicators
Below are some additional key performance indicators that may be helpful in assessing a company’s overall financial health and performance.
How we can help
CLA offers this publication as a resource for companies in the construction industry. It is intended to assist management by providing comparable data, industry trends, and other information to help them make strong financial decisions.
A more detailed comparison of financial results is available through the CLA Benchmark Analysis. This analysis provides a comprehensive comparison of a company’s financial results to a defined group of similar contractors that are selected using a number of factors, including geographic operating region, company size, union or non-union labor force, public or private work focus, and many other considerations. The analysis provides for easy comparison between different-sized companies and combines balance sheet and income statement analysis, along with a graphical comparison of approximately 40 key performance indicators.
The information presented in a benchmark analysis has assisted many construction companies in identifying areas for improvement and highlighting aspects of their business that need further attention. A company’s decision-makers can use the analysis on an ongoing basis for strategic planning, risk mitigation, internal budgeting, and to help define and track financial and operating goals.
Check out the broader construction industry benchmarking report.