
Stock markets continue to trumpet good news as we look at why valuation matters, the outlook for banks and the financial sector, and the impact of hurricane recovery.
The immensely powerful hurricanes that battered parts of Texas, Florida, and the Caribbean were arguably the most remarkable events of the third quarter of 2017. Even as we discuss the economic impacts, we are mindful of the human hardships and tragedies that these storms have wrought. Our thoughts and prayers remain with those affected and, as is often the case, still struggling with the aftermath.
The near-term economic impact of hurricanes Harvey, Irma, and Maria will be significant. The Gulf Coast region’s employment data will worsen. The large amount of property damage and business losses will hurt the economy in the short-term. While the storm damage assessment is ongoing, some analysts have sought to quantify the effect on large publicly-traded companies in the S&P 500.
According to FactSet, estimated third quarter S&P earnings fell $1.6 billion (to $292 billion from $293.6) from the period of September 5 ‒ 26. Not surprisingly, the largest hit sectors are insurance, chemicals, and airlines. Insurance companies, which will be paying some sizable claims, accounted for more than a quarter of the total estimated earnings loss. Insurance giants Progressive Corp. and The Travelers Company slashed their third quarter earnings estimates by about one-third. The loss in estimated earnings from chemicals is attributed entirely to Dow DuPont, which guided earnings down 22 percent as Harvey temporarily caused refining facilities to close in the Houston area. With countless flights being grounded due to the storms and increases in fuel prices, airlines also revised third quarter earnings lower.
Economists expect the negative storm effects to be short-lived. As stated by the Federal Reserve, “past experience suggests that the storms are unlikely to materially alter the course of the national economy medium-term.” We certainly hope this is the case, and wish all the best as homes and businesses are rebuilt.
Moving away from the tragic storms, we present positives and negatives we see in the big economic picture:
| Positives | Negatives |
|---|---|
|
|
Geopolitical risks were certainly more in the forefront during the third quarter, with North Korea launching rockets and exchanging verbal barbs with the American president. U.S. policy uncertainty, as the Trump administration continues to attempt health care and tax reform, continues to be a negative. One of the key positives underpinning the economy continues to be the firm U.S. housing market. The S&P CoreLogic Case-Shiller home price index increased by 5.9 percent in July, beating estimates (S&P Global). On the whole, however, we view the big picture as mostly positive.
Third Quarter and Year-to-Date 2017 Index Returns (%)
| Index Name | Capital Market Segment | June – Sept. 2017 | 2017 YTD |
|---|---|---|---|
| Bloomberg Barclays U.S. Aggregate | U.S. Broad Market Bonds | 0.9 | 3.1 |
| S&P 500 | U.S. Large Cap | 4.5 | 14.2 |
| Russell 2000 | U.S. Small Cap | 5.7 | 10.9 |
| MSCI EAFE* | Non-U.S. Developed Markets | 5.4 | 20 |
| MSCI EM** | Emerging Markets | 7 | 27.8 |
| Hypothetical 60/40 Portfolio*** | Diversified Mix of Indexes | 3.4 | 11.2 |
*Europe, Australasia, and Far East
**Emerging Markets
***40% Barclays U.S. Aggregate, 32% S&P 500, 7% Russell 2000, 16% EAFE, and 5% EM
An investor cannot invest directly in an index, and the hypothetical portfolio is not intended to reflect any specific portfolio managed by CLA Wealth Advisors. An unmanaged index does not reflect any expenses that may be associated with an actual portfolio.
Source: Morningstar
Longest bull market since World War II
U.S. stock prices continued to rise in the third quarter. The large cap S&P 500 returned 3 percent for the quarter, and is up 14 percent year-to-date. Small caps stocks, as measured by the Russell 2000, had a nice run in the third quarter and are now up nearly 11 percent year-to-date. Growth stocks continue to outperform value stocks (Morningstar).
The stock market headlines have mostly trumpeted good news — and why not? Bad news has been exceedingly hard to come by. Here are some examples of how 2017 has been a remarkably comfortable ride for investors:
- The S&P 500 closed at all-time highs multiple times during the past quarter, and has done so a total of 37 times so far this year (Bloomberg).
- For the first time in 12 years, there have been no trading days (so far this year) in which the market moved 2 percent or more.
- The S&P 500 has posted a positive return, including dividends, in every calendar month so far in 2017. This is unusual. Going back to 1926, there has never been a calendar year in which there has not been one down month.
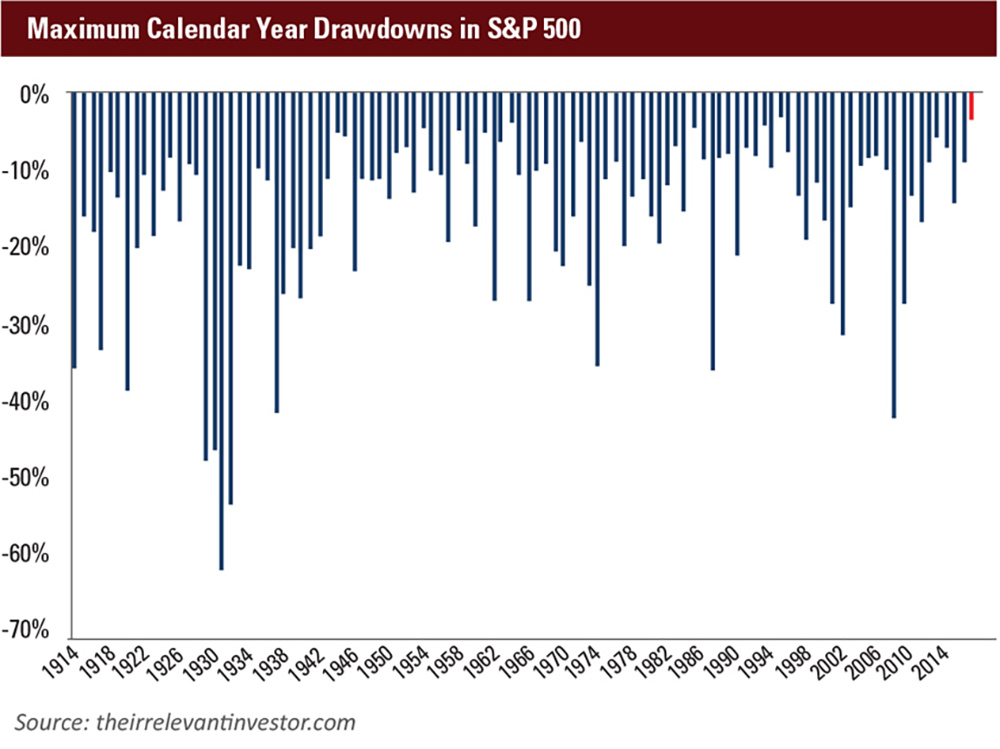
- The maximum drawdown (the biggest peak-to-trough price movement) in the S&P 500 so far this year has been the lowest in modern market history. The chart below shows calendar year maximum drawdowns (theirrelevantinvestor.com).
Looking at the longer-term market trend, we note that we are also now officially in the second largest bull market run since World War II.
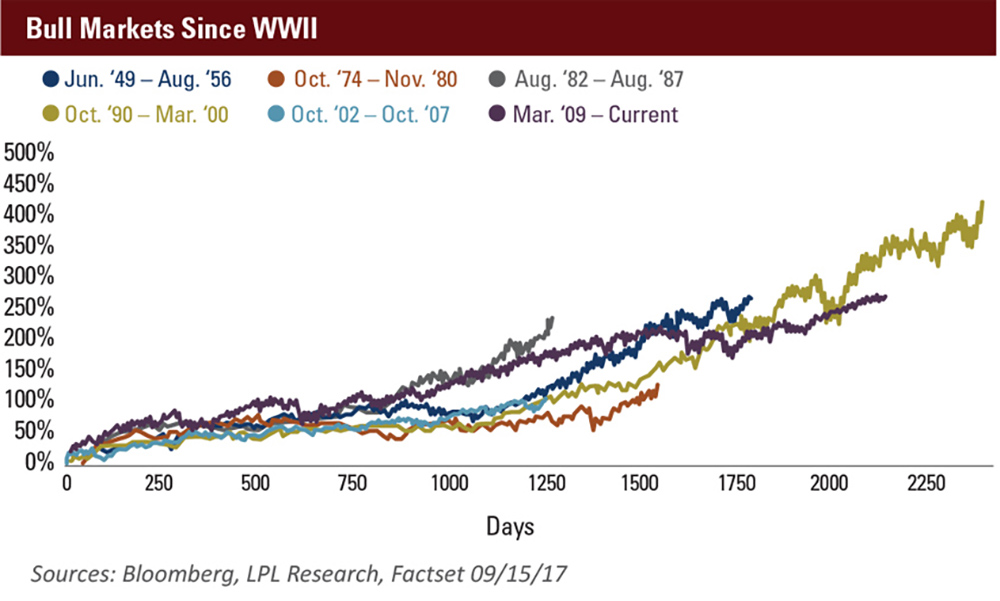
As of September 15, the S&P 500 had gained 270 percent since the market low in March 2009. Only the bull market of October 1990 – March 2000 had a larger gain.
Bond markets flat or up slightly
Fixed income markets were also up for the quarter. The broad U.S. bond market, as measured by the Bloomberg Barclays U.S. Aggregate, just eked out a positive return for the quarter and is up a little more than 3 percent for the year. The widely-watched 10-year U.S. Treasury yield ended the three-month period at 2.34 percent, up rather sharply from nearly hitting 2 percent in early September. As ever, Federal Reserve interest rate policy will be among the key factors impacting rates going forward. The Fed held pat at the September meeting, but the market expects a quarter-point rate increase later this year and perhaps two more in 2018.
Municipal bonds were flat for the quarter, but have a robust total return of 4.7 percent year-to-date (Bloomberg Municipal Index). One factor boosting municipal bonds is favorable supply and demand, i.e., new issuance is down 15 percent this year (Bloomberg).
Policy uncertainty has also affected the muni market. The Trump administration’s new tax proposal may seek to eliminate the state and local tax deduction. Critics of this tax break say that allowing people to deduct state and local taxes from their federally-taxable income costs the U.S. government revenue, while disproportionately benefitting high-tax states, especially California, New York, and New Jersey. If this deduction is eliminated, it will create more havoc with the supply and demand picture, as high net worth investors in affected states will likely seek to place a lot of capital in tax-exempt muni bonds.
Last quarter’s Market and Economic Outlook alluded to the precarious situation of Illinois’ municipal debt. This situation has improved. The state is coming to market with its biggest bond offering in years and the 10-year general obligation bonds will be priced at about 1.6 percent higher than the AAA muni benchmark (Bloomberg). This is almost certainly a relief to Illinois taxpayers. Triple tax-exempt Puerto Rico muni bonds, squarely in junk status before hurricane Maria made a direct hit on the U.S. territory, are trading even more cheaply now. Puerto Rico general obligation bonds, due in 2035, were trading at 50 cents on the dollar and trending lower as of September 25 (Bloomberg).
International stocks stay in positive territory
Developed international stocks continue have a great year. The MSCI EAFE (Europe, Australasia, and Far East), a key measure of developed economy stock markets, is up nearly 20 percent this year. Japan, the country with the largest weight in the EAFE, is up more than 15 percent in dollar terms, as overseas investor returns have been aided by a weakening yen. The second largest EAFE country component, the U.K., is also up more than 16 percent. Germany, where Angela Merkel recently won a fourth term as chancellor, is up nearly 27 percent year-to-day. We saw the same 27 percent increase in France.
Emerging market stocks are on a tear. Surging another 10 percent in the third quarter, the MSCI EM index was up 30 percent for the year. China, which carries about a 30 percent weight in the MSCI EM index, is up 26 percent in U.S. dollar terms, despite S&P downgrading its credit rating and the International Monetary Fund warning that Chinese credit growth was on a “dangerous trajectory” during the third quarter. Brazil and India equities are also up strongly in 2017. All country-specific returns are via Morningstar, using the MSCI Investable Market Index for each respective country.
Is the market overvalued?
Market valuation is not a new subject — we’ve talked about it frequently in the past. There are those who would ask, “Is the market overvalued by some measures? Does this mean a bear market is imminent?”
In short, no. Valuation readings have proven to be poor guides for timing inflection points in the markets. States of overvaluation (or undervaluation) can go farther and last longer than anyone might predict.
Valuation, like so many topics in finance and investing, can be maddeningly complex. There are countless methods that analysts, investors, and academic researchers use to try to determine if an individual stock or a broad basket of stocks, such as an index, can be deemed to be cheap, expensive, or neutral (or over-, under-, or fairly valued). Below is just a small sampling of different valuation ratios and metrics:
- Price/Earnings
- Price/Book
- Price/Cash Flow
- Price/Sales
- Enterprise Value/Revenue
- Enterprise Value/EBITDA (Earnings Before Interest, Tax, Depreciation, and Amortization)
- Dividend Yield
To make matters even more confusing, within each measure listed above, there are nuances in terms of how to calculate the numbers and many different time frames that can be used. Depending on how all these variables are used and analyzed, investors can arrive at differing conclusions.
It’s beyond the scope of this report to delve into a lot of these, but let’s look at one of the most widely used valuation metrics for stocks: the price-to-earnings (P/E) ratio. It is calculated by dividing a stock’s price by its earnings per share. But as we warned, there are multiple ways to calculate and analyze the P/E ratio. Here is a summary of three different versions:
| Type of P/E Ratio | Key Part of Calculation | Current Ratio | Relative Reading | Potential Takeaway |
|---|---|---|---|---|
| Forward P/E | Use expected earnings for the next 12 months | 17.5 | The 10-year average is 14.1 | Valuations elevated, but not egregious |
| Trailing P/E | Use previous 12 months earnings as reported | 25 | Well above long-term average of 16 | Valuations elevated |
| Shiller P/E (CAPE) | Use inflation-adjusted average of previous 10-year earnings | 30 | Far above long-term average; only third time in history reaching 30 | Valuations very elevated |
Sources: FactSet and www.multpl.com/shiller-pe
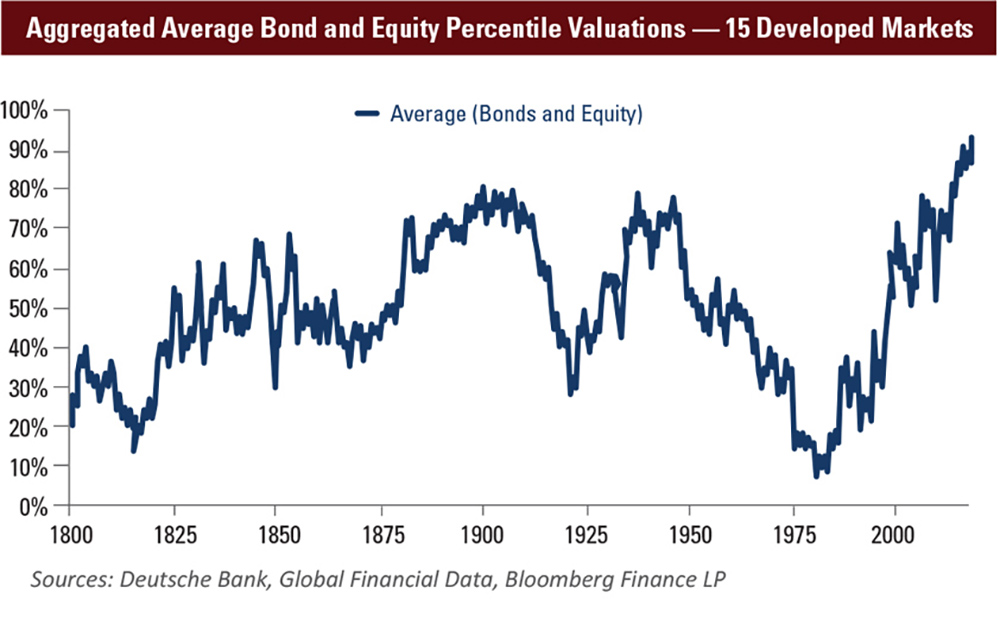
In reviewing disparate valuation metrics, it becomes difficult to find measures that show stocks or bonds, especially in the U.S., to be cheap. Conversely, it is much easier to find examples of metrics showing assets to be overvalued. Take, for example, the analysis below from Deutsche Bank. They produced an aggregated stocks and bonds valuation metric for the 15 largest developed markets. It paints a rather gloomy picture of the current capital markets’ valuations.
Despite not providing a proverbial crystal ball, valuations do matter, especially with regard to forward-looking return assumptions. In the January issue of Market and Economic Outlook we wrote that research suggests that stock and bond returns over the next 10 years will likely be materially lower than the previous decades. Rich valuations are a key component of this widely recognized issue.
What is an investor to do when facing the prospect of lower returns from the stock and bond markets? In our view, investors can expand their opportunity set. We therefore often construct client portfolios, where appropriate, that make use of alternative investments, whose risks and returns are uncorrelated with stocks and bonds.
Banking on strong banking
The financial sector is a large component of the U.S. economy, creating nearly $1.3 trillion in annual economic output, or more than 7 percent of total gross domestic product. The U.S. banking system not only holds about $16 trillion in assets, it is the source of private credit for individuals and businesses, which is the lifeblood of the U.S. economy (statistics reflect year-end 2015, SelectUSA.gov).
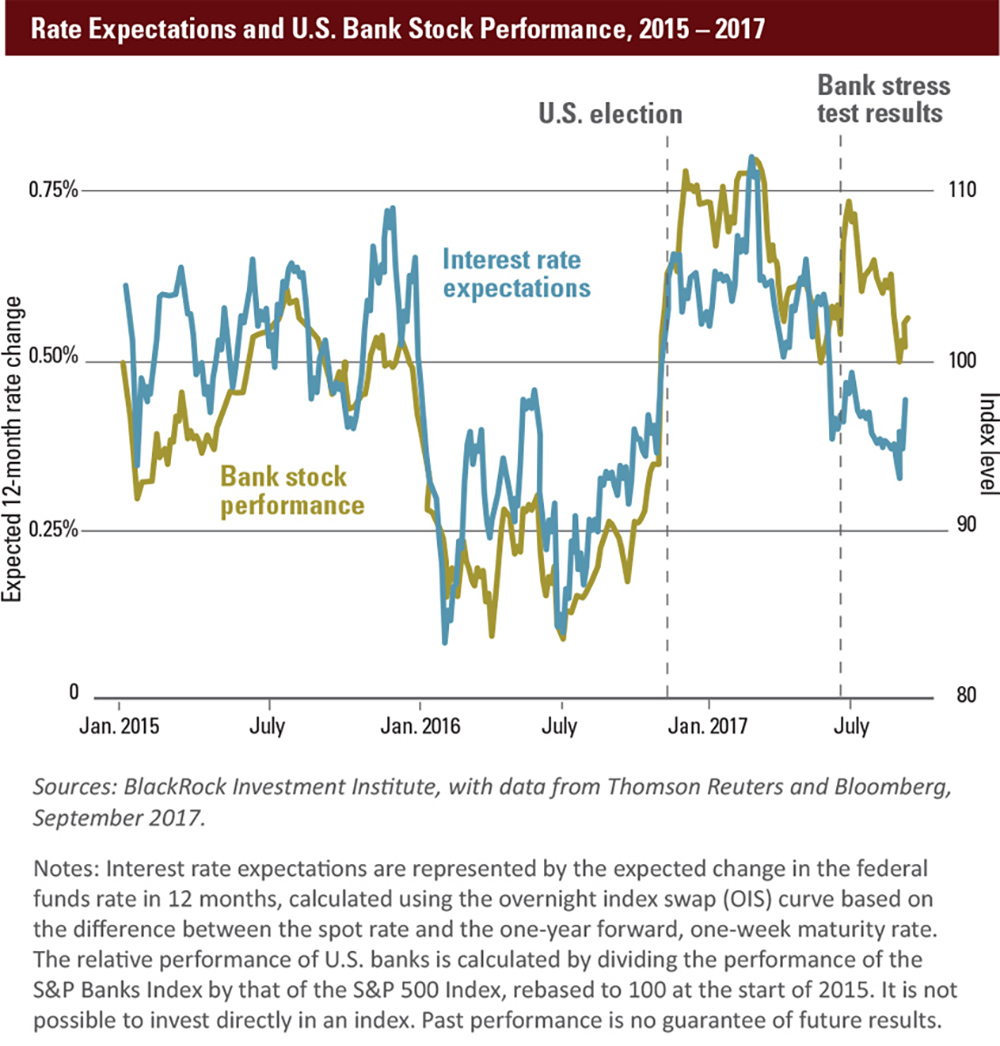
With regard to publicly-traded financial institutions stocks, the last 12 months have been a somewhat volatile ride. After surging post-presidential election, bank stocks had lagged year-to-date in 2017. But there are signs of a reversal. This is due to one of the notable aspects of bank stocks, namely, that they trade in harmony with interest rate expectations, as illustrated in this chart.
Bank Stocks Total Returns as of September 25, 2017
| Name | YTD 2017 | Trailing 12-months | Trailing 3-years | Trailing 5-years |
|---|---|---|---|---|
| U.S. Financial Sector Stock Index1 | 8.96 | 30.91 | 12.94 | 15.92 |
| S&P 500 TR USD | 13.18 | 17.74 | 10.60 | 14 |
1MSCI U.S. Investable Market Index/Financials 25-50 Index
Source: Morningstar
Banks lend money at intermediate and long-term rates, and pay depositors short-term rates. Rising rates, especially when there is a “steepening yield curve” (longer rates rising faster than short rates), increases the likelihood of bank profits. Regional and smaller banks — which makes up the bulk of CLA’s financial institution practice — could benefit the most from rising rates. They provide mostly traditional loans/deposits services, as compared to mega-cap financial services companies, which have many different business lines, such as investment banking and asset management.
Charlie Cameron, CLA’s managing principal for the financial institutions industry, says that he anticipates margins for community banks to continue to expand as the Fed inches interest rates higher.
“During the financial downturn and subsequent recovery period, banks saw their margins steadily constrict,” Cameron said. “In fact, total revenue (net interest margin and noninterest income) as a percentage of average assets shrunk during this period. Recently, we have seen this trend reverse, with net interest margins expanding as a result of higher loan yields and stronger loan volume growth. Clearly, the market expectation is that bank returns on equity will be higher as a result of further growth in net interest income as the Federal Reserve continues to execute its current tightening policy.”
In addition to expected rising rates, analysts see a more favorable regulatory environment as a factor working in favor of financial stocks and bank profitability. The current administration has proposed changes that include easing restrictions on trading operations of big banks, lightening the annual liquidity and capital stress tests, and reducing the power of entities such as the Consumer Financial Protection Bureau.
“The change in the regulatory environment is a big deal when you think about the outlook for the financial institution industry. The pace of new regulations for the industry has slowed dramatically,” Cameron said. “Even though the industry has not seen substantial repeal of existing regulations to date, and the regulatory environment for financial institutions of all sizes remains challenging, fewer new regulations is a welcome relief for the industry.” He said the administration’s benchmark of eliminating two regulations for every new regulation imposed has helped contribute to a more positive outlook for the financial institution industry.
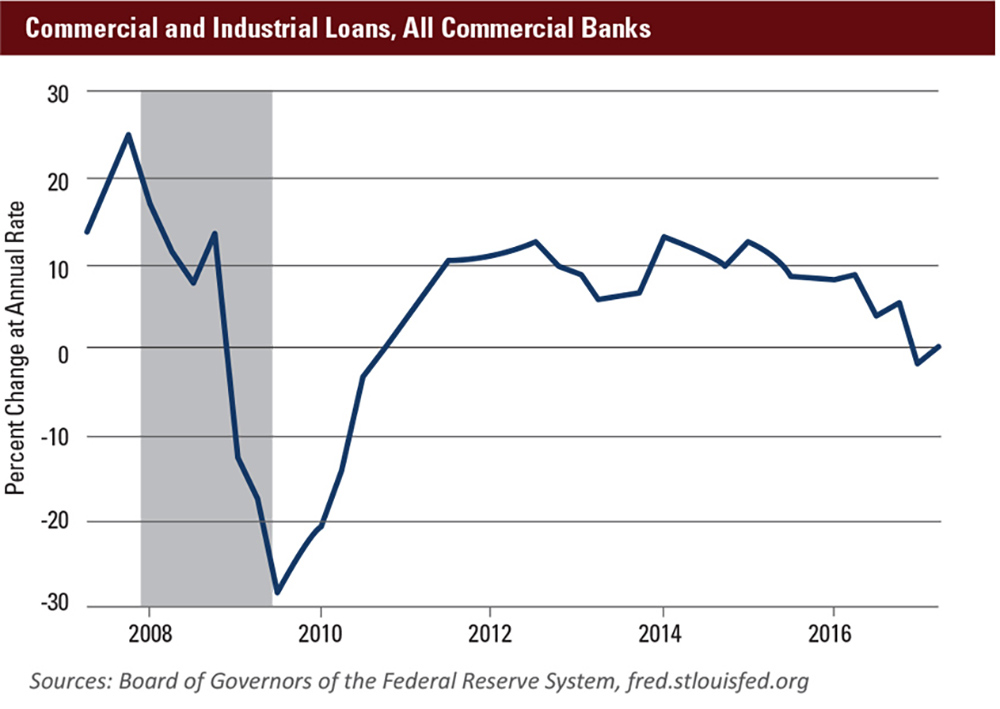
Total loan growth, which is a key metric for the banking sector, has slowed in recent years due mainly to commercial and industrial loan weakness. Some analysts are keen on a turnaround, however. Bank lending standards are loosening, and business owner optimism may spur loan demand. Recent evidence shows this expectation starting to unfold. Total loan growth for community banks in the second quarter of 2017 was at 2.7 percent from the previous quarter, exceeding the growth rate of 1.5 percent at larger banks for the same period.
There are certainly some challenges to be faced by the financial services industry in general and banking specifically. Some of these can be traced to new, disruptive technologies that have the potential to change the structural framework of the financial industry. Some of these potential game-changing technologies include:
- Blockchain — Besides just digital currency applications like bitcoin, blockchain technology could disrupt many aspects of the financial industry, from clearing and settling stock trades, to payment systems and beyond.
- Peer-to-peer lending — Companies use an entirely digital (no bank branches) model to quickly match borrowers with investors.
- Crowdfunding — Websites that can provide entrepreneurs with investors’ capital.
- Robo-advisors — Firms that use computer algorithms to provide customers with investment allocations.
- Mobile payment systems — Companies are using digital platforms to transfer money and convert currencies for less than traditional banks charge.
“For community banks, technology-driven changes generally represent both challenges and opportunities,” Cameron said. “The community banks we work with are generally not on the cutting edge of these technologies, but their impact on the industry will continue to filter down. Technologies are typically adopted to create efficiencies and reduce costs, and that is something most institutions have made a priority.”
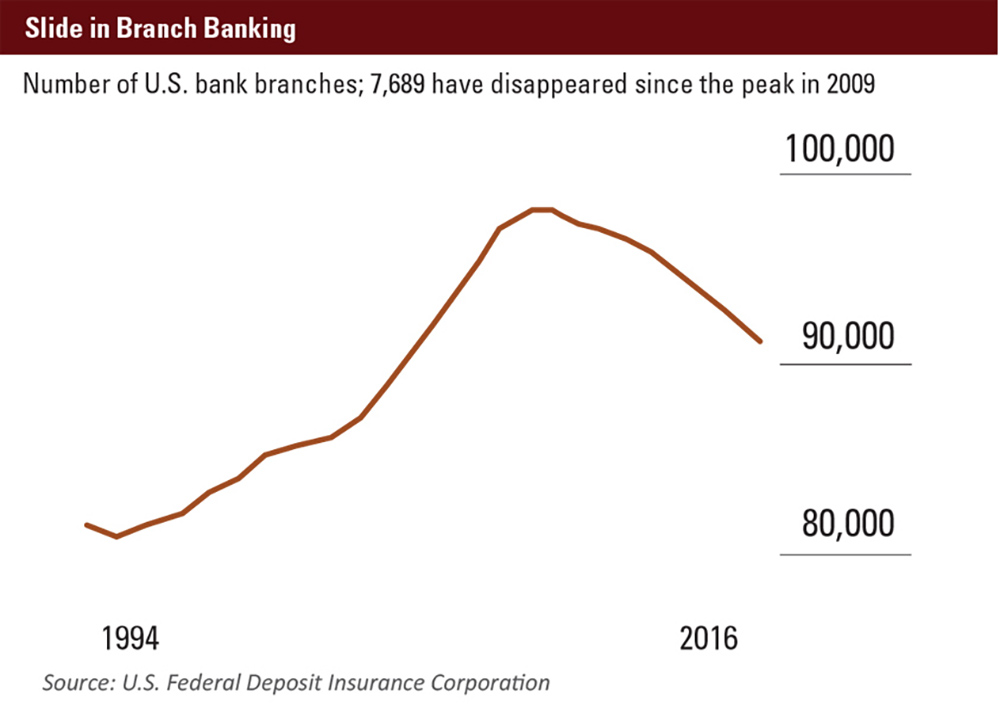
He added that over the past several years, in the absence of organic revenue growth, community banks overall have had to cut overhead costs as a percentage of average assets in order to return to pre-downturn profitability levels. For many entities, this took the form of office consolidation as new technologies have reduced the historical importance of the geographic convenience factor in banking, an observation illustrated by the drop in the number of bank branch offices since 2009.
Risk persists amid optimism for the fourth quarter
In summary, while risk assets are generating pleasing returns with somewhat muted volatility, we remain always cognizant of the risks that may lurk, and construct client portfolios accordingly. While our hearts our heavy with thoughts of those suffering from the recent storms, we look forward with optimism to the final quarter of 2017.