

In the Q3 Market and Economic Outlook (MEO) we discuss inflation, state of the market, and the potential impacts of the upcoming presidential election.
Key insights
- Large cap stocks, led by technology names, continue to surge.
- U.S. stocks continue to beat foreign stocks.
- Elections matter — but for the market, not as much as you might you think.
- The Fed’s new approach to inflation underscores “lower for longer” interest-rate theme.
Would you like more information?
The S&P 500 regained all-time highs as monetary and fiscal stimulus packages continue to provide a tailwind to risk assets. We review Q3, discuss our view on inflation, and examine how presidential elections affect markets.
Stock prices posted a strong third quarter, despite suffering losses and high volatility in the month of September. The S&P 500, having fallen −34% in a little more than 30 days from mid-February to mid-March earlier this year, fully recovered those losses in late August and reached a new all-time high in early September. As a possible hopeful sign for the strength of economic recovery, consumer discretionary stocks realized the best quarter of all the S&P sectors. Only the technology sector has better returns on a year-to-date basis.
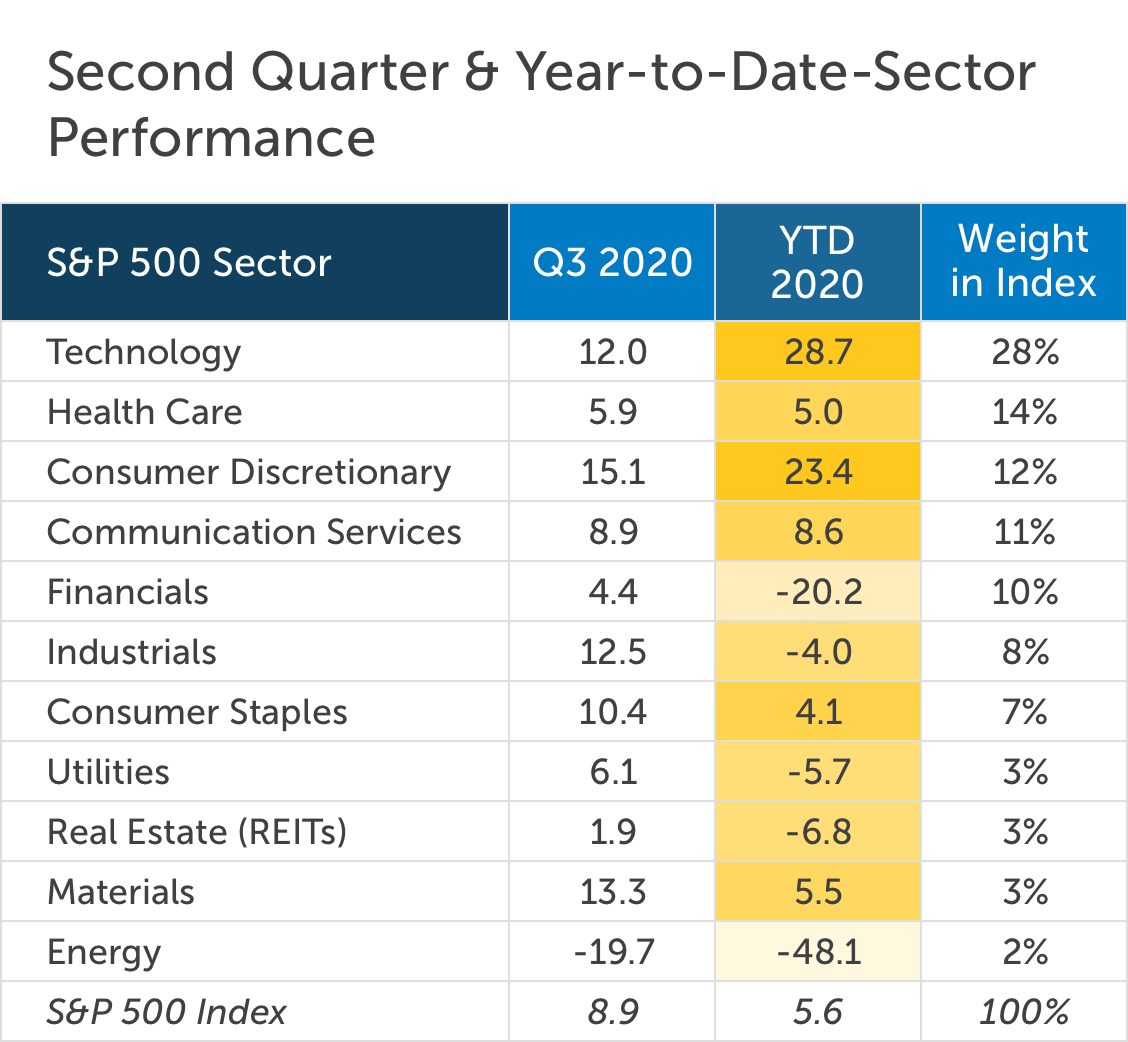
Source :JPM and S&P
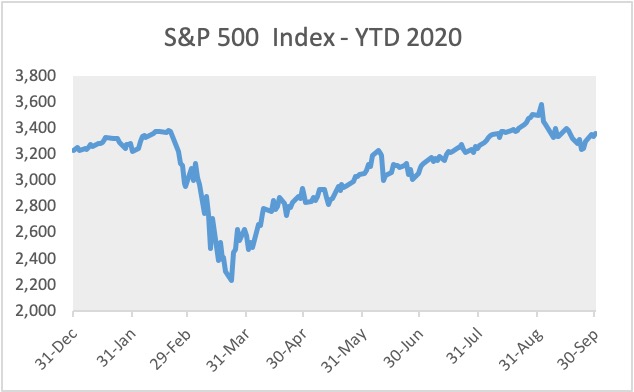
Source: Bloomberg; daily returns
Volatility in the bond market remained low in third quarter. Bond prices have generally traded in a very narrow range since the massive volatility in Q1. The Fed’s interventions into the fixed-income markets continue to provide price support and stability to the bond market.
Driven mostly by a small handful of tech behemoths (the “FAANGM” stocks, Facebook, Apple, Amazon, Netflix, Google, Microsoft), U.S. large cap stocks continue to outperform small caps and non-U.S. stocks. Investors with diversified equity portfolios may sometimes need reminders of why they have small cap and non-U.S. exposures. Small caps stock offer attractive relative valuations (i.e., they are cheaper than large caps) and also generally “pro-cyclical,” meaning they should perform well on the upside in periods of economic recovery. Non-U.S. stocks also offer attractive valuations. We currently have a favorable view of European equities, based on recent strong and coordinated economic stimulus plans, and should be positioned well for a post-pandemic world.
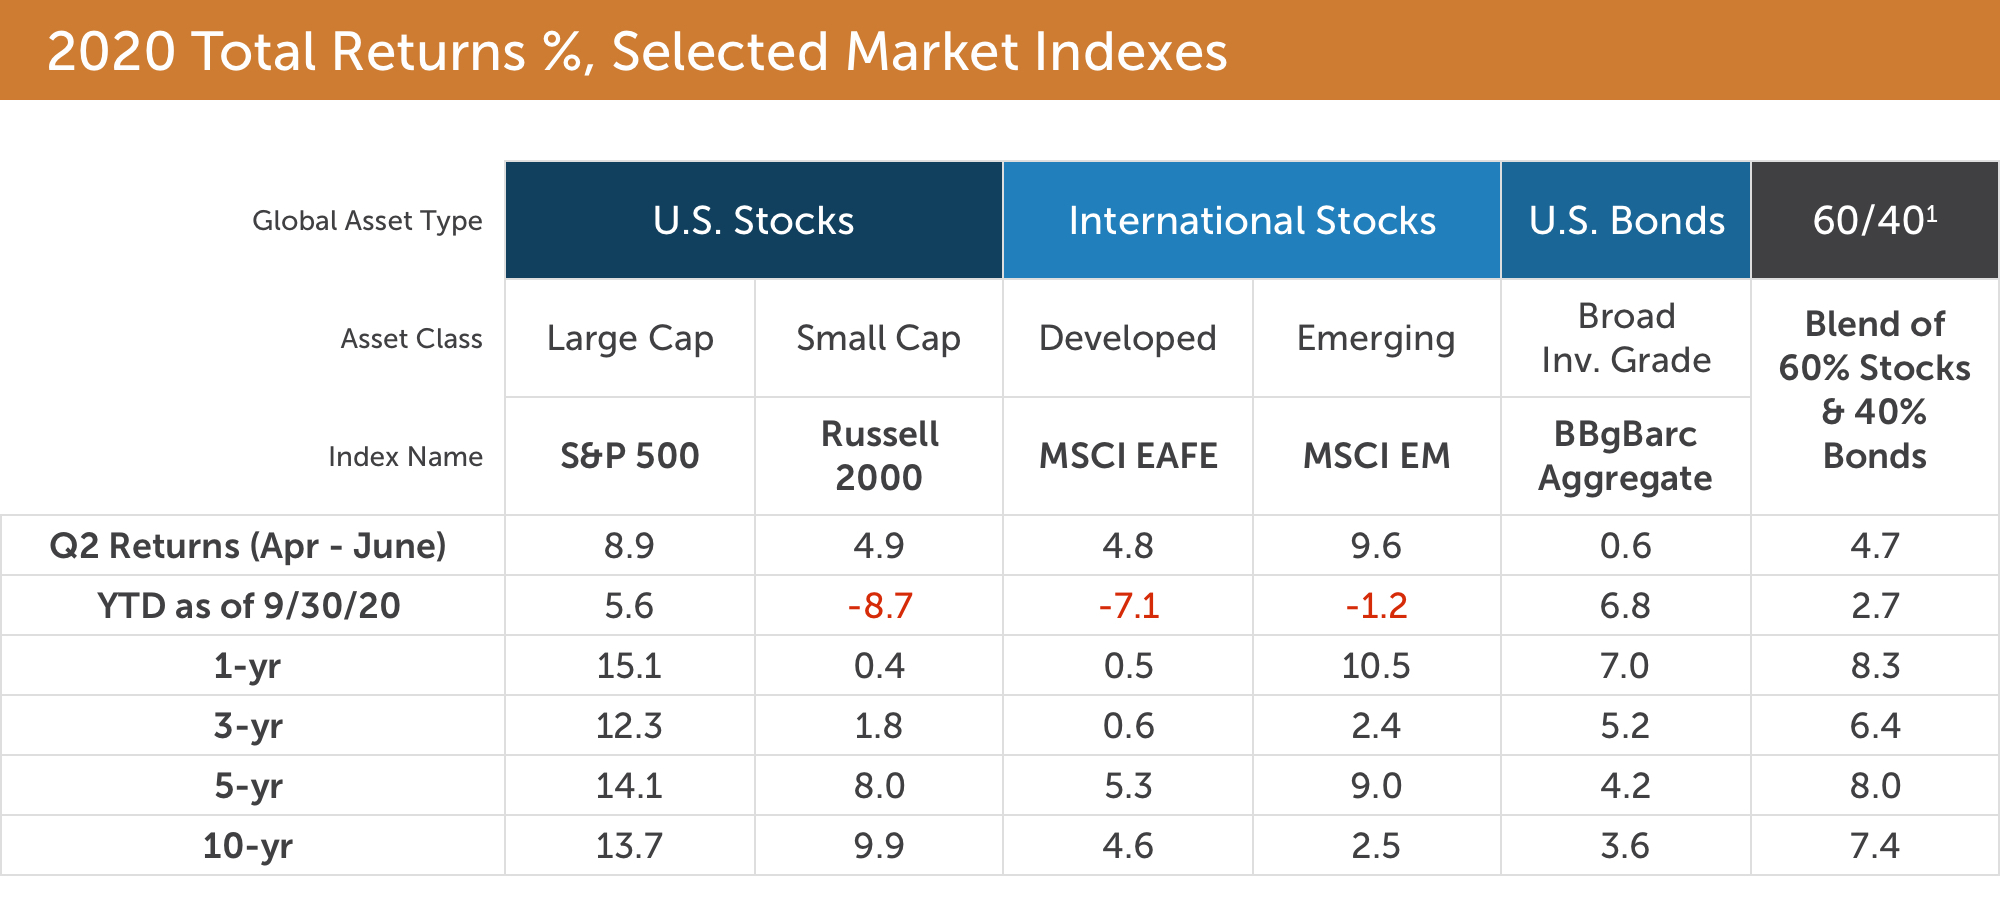
1 Hypothetical 60/40 blend comprised of: 40% BBg Barclays U.S. Aggregate, 32% S&P 500, 7% Russell 2000, 16% MSCI EAFE, and 5% MSCI EM.
An investor cannot invest directly in an index, and the hypothetical portfolio is not intended to reflect any specific portfolio managed by CLA Wealth Advisors. An unmanaged index does not reflect any expenses that may be associated with an actual portfolio.
Returns above are total returns %, annualized for periods of longer than 1-yr. Past performance is no guarantee of future results.
Source: Morningstar
The status of the COVID-19 pandemic over the next several quarters will obviously be hugely impactful. A potential spike in infections in the fall and winter could create economic and market turbulence. Most would say that a full economic recovery could happen once a vaccine has been developed, tested, approved, and delivered across the country and the globe. No one can know precisely how soon this will happen, but the outlook has grown increasingly positive (see chart below).
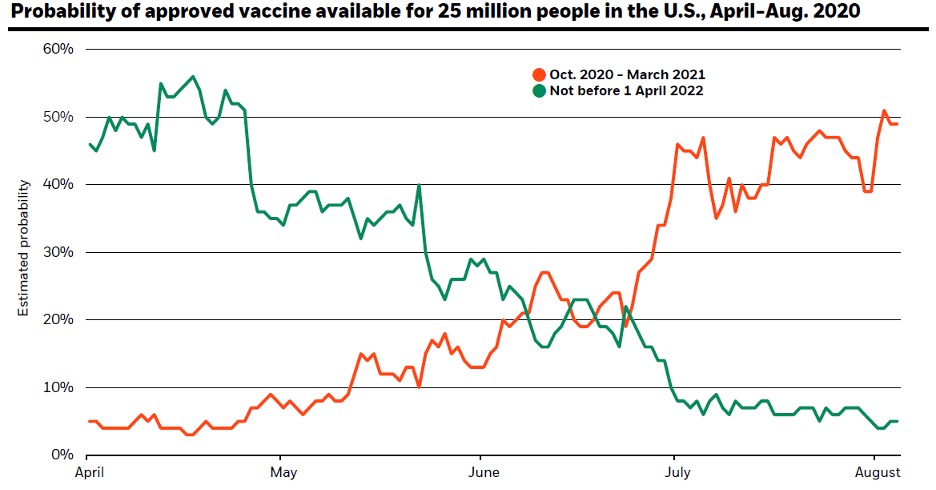
Source: BlackRock Investment Institute, using data from Good Judgment Superforecasters project, Sept. 2020. The chart shows the probabilities assigned to various time frames that an FDA-approved vaccine might be available to inoculate 25 million people in the United States.
The upcoming election and the markets
The upcoming election is weighing on nearly everyone’s mind. Political divisions seem wider than ever, and emotions are running high. Investors are also wondering how the outcome could affect their portfolios.
Our job as investment advisors is to limit, as best we can, our own political and emotional biases and provide advice based on dispassionate analysis. As we examine the historical data related to the markets and elections, we conclude that investors should not change their long-term investment strategy because it is a presidential election year or make changes based on whether their preferred candidate wins or loses. Let’s look at some of the data.
When we take in the long view, we can see that the market has risen persistently across time, regardless of the president’s party affiliation.
Markets have provided long-term growth even as Presidential administrations change
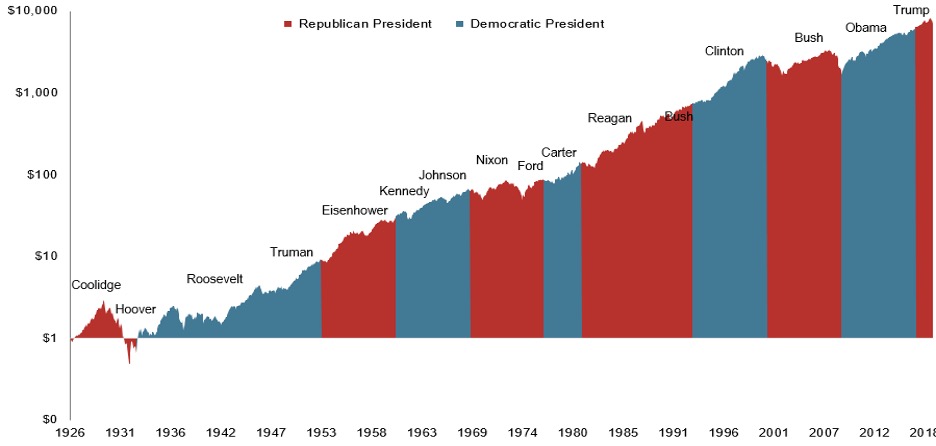
Source: S&P data © 2019 S&P Dow Jones Indices LLC, a division of S&P Global .
Additionally, the stock market has posted a positive return in 69 of the last 94 calendar years, or about 73% of all years (1926 – 2019, Standard & Poor’s).
The stock market reflects the strength and resilience of the American economy, not so much the attributes of a given political party. And when recessions and bear markets happen, the source is often “exogenous” in nature — an outside shock, such as the COVID-sparked recession and bear market of earlier this year. To paraphrase Schwab’s chief investment strategist, Liz Ann Sonders, what’s happening in the economy dictates what politicians do, not the other way around.
When we examine past stock market performance under the lens of partisan control of all branches of the executive, there is no clear evidence that points to one arrangement being ideal. The data below show the average annual return of the S&P 500 based on which major party has control of the Senate, House of Representatives, and the presidency, respectively. One notable takeaway: The market data appear to favor “split powers,” that is, when neither party controls all three parts of the executive. The intuition would be that the “check and balances” of a split arrangement inhibit the tendency toward more extreme policies.
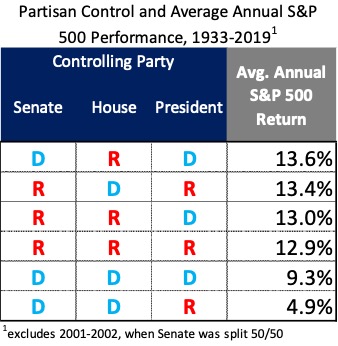
Source: Strategas Research
Some are concerned about what they perceive as the inherent risks of it being an election year. Once again, the historical market data do not show that election years are especially risky. Vanguard researched the returns of a 60/40 portfolio (60% U.S. stocks and 40% bonds) going back more than 150 years. The average return of a 60/40 portfolio during non-election years was 8.1% (120 calendar years), while the average return for election years was 8.9% (40 calendar years). As for stock market volatility before and after election days, there has been no statistical difference at all.
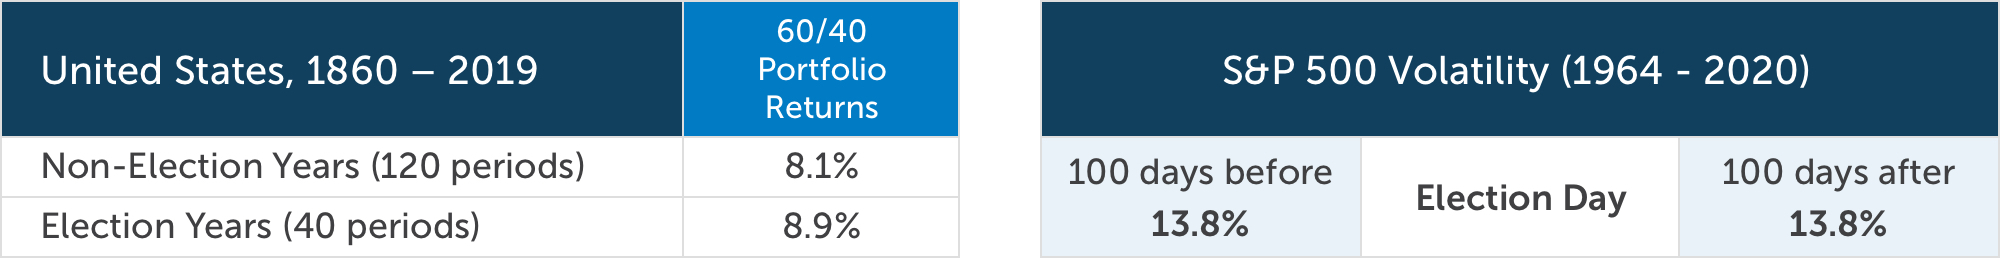
Source: Vanguard calculations. 60/40 portfolio based on 60% U.S. stocks and 40% U.S. bonds, provided by Global Financial Data. S&P 500 volatility based on daily volatility.
The usual disclaimer applies: Past performance is no guarantee of future results. There is a chance that this upcoming election could provide more volatility than average, especially if the results are contested and end up as a legal controversy to be decided by the courts. But before we use the term du jour — “unprecedented” — to describe such a situation, we can recall that it was only two decades ago that the U.S. Supreme Court settled the 2000 presidential election via Bush v. Gore. The capital markets have proven to be very resilient in even the most hotly contested elections.
Elections matter, and there is a lot at stake November 3rd. Taxing-and-spending, foreign policy, court appointments, and regulatory regimes — to name just a few things — are all hugely important topics that will be influenced in the years to come by the outcome of the election. We would urge all to advocate passionately for their preferred candidates and to exercise their right to vote. We do not believe, however, that investors should abandon a well-thought-out investment strategy because of the outcome of the upcoming election.
Inflation: Unpacking the Fed’s change to its decision-making framework and how that affects our outlook
Inflation, the measure of the rate at which price levels increase over a period of time, is a fundamental economic metric that is, in a sense, always a concern for consumers and investors. It took center stage this quarter when the Fed announced in late August a significant change to how it plans to set policy as it relates to inflation. Previously, the Fed explicitly targeted a 2% inflation rate and was loathed to ever allow readings to go above that mark. Going forward, they will instead target 2% on average and will be comfortable allowing inflation to run hotter over indefinite periods of time.
“Many find it counterintuitive that the Fed would want to push up inflation,” Fed chair Jerome Powell stated in public remarks on August 27; “however, inflation that is too low can pose serious risks to the economy.”
What does this change in the policy-making framework mean? This effectively means that the Fed will be even less inclined than they were previously to hike policy rates. This further entrenches our view, which we’ve written about before, on the concept of “lower for longer” as it relates to short-term interest rates. There continues to be a lot of support for this view. According to Bloomberg Economics’ estimate, the Fed’s new inflation-targeting plan means that a rate hike is unlikely to happen until at least 2025.
This change also signals that the Fed is concerned about falling inflation expectations. Low inflation expectations are pernicious as they can lead to a deflationary spiral. Low (or falling) inflation can make holding cash (instead of spending cash now) more attractive and potentially thwart wage growth, even if unemployment is low. The Fed will hope that the policy change to allow inflation to go higher and for longer will lift inflation expectations and thereby avoid these dangers.
Running below target
The Fed’s preferred inflation gauge is the PCE Index, a monthly report on household spending, compiled monthly by the Bureau of Economic Analysis. PCE, Price Consumption Expenditures, has mostly run below the Fed’s 2% since the Great Financial Crisis.

Source: U.S. Bureau of Economic Analysis
It is interesting to note that while the Fed is focused on raising inflation (and inflation expectations), some investors are concerned about the specter of high inflation. Those investors who either lived through or have studied the 1970s will know that high inflation can be very painful. Some fear that the Fed’s aggressive money printing may lead to higher inflation. Our view is that high inflation is not a near-term concern. We do recognize that there is the potential for higher inflation as we look out to the “medium term.”
The concept of lower for longer is more than just an abstract economic concept. It creates a problem for investors, especially those with a relatively large fixed income allocation and those who rely on their portfolios to generate income. At the very short end of the rate curve, yields are effectively zero. As you go farther out, income potential is still paltry; the 10-yr U.S. Treasury bond, as of quarter end, yields less than 0.7%. Given this backdrop, we believe investors will need portfolios that are flexible. The ability to diversify beyond Treasuries and investment-grade corporate bonds may be necessary for investors to meet their income needs.
CliftonLarsonAllen Wealth Advisors, LLC
Investment Committee
The purpose of this publication is purely educational and informational. It is not intended to promote any product or service and should not be relied on for accounting, legal, tax, or investment advice. The views expressed are those of CLA Wealth Advisors. They are subject to change at any time. Past performance does not imply or guarantee future results. Investing entails risks, including possible loss of principal. Diversification cannot assure a profit or guarantee against a loss. Investing involves other forms of risk that are not described here. For that reason, you should contact an investment professional before acting on any information in this publication. Financial information is from third party source s. Such information is believed to be reliable but is not verified or guaranteed. Performances from any indices in this report are presented without factoring fees or charges, and are provided for reference and competitive purposes only. Any fees, charges, or holdings different than the indices will effect individual results. Indexes are unmanaged; one cannot invest directly into an index. Investment advisory services are offered through CliftonLarsonAllen Wealth Advisors, LLC, an SEC-registered investment advisor. Prior approval is required for further distribution of this material.