

Looking for a ray of hope in the market? Recent trends could suggest a V-shaped recovery, which is good news for bullish investors.
Key insights
- Is the market shaping up for a V-shaped recovery?
- The market seems to care more about the duration of any financial event than the depth.
- Investors may be able to lean into discomfort and strategically position themselves for the future.
Struggling to navigate this topsy-turvy market?
Across the country, some states are making moves to turn on the lights and proclaim, “We are open for business!” even though much uncertainty remains about COVID-19 and its ongoing effect on the nation’s health and economy.
Recent reports suggest that though Coronavirus cases are declining in hot spots like New York, they are on the rise in other parts of the country.
However, Wall Street investors don’t seem to be particularly concerned about how it will all shake out in the coming weeks, months, and years to come. Perhaps this is because the market cares more about the duration of any financial event than the depth.
Based on the past couple of weeks, some expect we will see a quick V-shaped market recovery. The initial cascade of selling seems to be over and those who wanted out are out. Now the market appears to be attracting discount buyers.
Though investors may have a fear of missing out (FOMO) on the opportunity to scoop up stocks at a discount, that herd mentality could quickly overheat an already stressed market if the fundamentals are not there to support it.
There are still many factors (or “known unknowns”) to be considered, measured, and weighed. Here are a few examples:
- Duration — How long will it take for the economies of the country and the world to get back to operating at 100%?
- Health and safety — When will we have a therapeutic and a vaccine and when will they be widely available?
- One step forward and two steps back — If we’re not pragmatic about reopening the country, will there be a second wave of the pandemic in the winter as Dr. Anthony Fauci recently postulated in a White House briefing earlier this week?
Even with these “known unknowns” — and except for a few down days in recent weeks — equity gauges have been mostly on the uptrend since posting record lows on March 23. The Dow is up about 19.68% since its late-March closing low, back when fears of potential economic damage from the coronavirus pandemic gripped the market, leaving the blue-chip index 23.9% down from its Feb. 12 record peak. The S&P 500 and the Nasdaq Composite indexes are up 19.9% and 23%, respectively, since their late-March swoon (through they are still down 17.3% and 5.9% from their respective record highs). [data source: Dow Jones Market Data as of May 7, 2020]
So are investors experiencing FOMO? Are investors underestimating the challenges of restarting economies? Is the worst behind the stock market after a coronavirus-induced rout? Is there any empirical evidence to help justify the recent weeks’ recovery?
No one knows for sure, as officials attempt to restart economies from a self-imposed period of hibernation to flatten the curve. But perhaps there is a ray of hope for investors hidden in the numbers. Let’s take a closer look.
Covid-19 and the VIX
Torsten Slok, Chief International Economist at Deutsche Bank Securities, recently published the chart below. It shows the number of countries with higher than 5% daily COVID-19 infection growth rates alongside one of Wall Street’s most closely followed indicators of volatility, the Volatility Index (VIX).
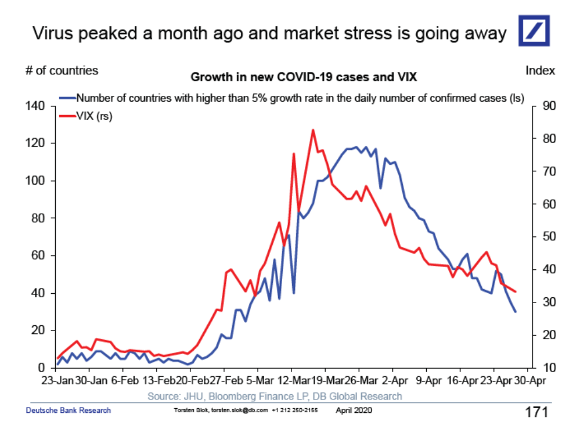
Reprinted with permission from Torsten Slok, Deutsche Bank Securities
The chart implies that both the public-health crisis and market volatility may have peaked, which is a potential good sign for bullish investors.
- The blue line — showing the number of countries with a higher than 5% daily growth rate of COVID-19 infections — indicates that the virus may have peaked in late March to early April.
- The red line shows that the VIX hit its peak on March 16 at 82.69, besting its high of 80 during 2008 financial crisis.
The VIX is a popular measure of the stock market’s expectation of volatility based on S&P 500 index options. It tends to rise when stocks fall and decline as markets rise.
A common sentiment among investors with higher risk appetites is, "When the VIX is high, it's time to buy.” So the question remains: is this good news for the bulls or are there still reasons to remain bearish, at least for now?
How we can help
CLA Wealth Advisors is a RIA committed to our clients. Our team of reliable advocates provide customized advice through curated portfolio strategies to help you meet your financial planning objectives.
Contact Us