Nonprofits are no stranger to benchmarking. In a sector where positive outcomes are the ultimate measure of success, benchmarking is an essential tool for strategic planning.
I’m a hockey fan, and I have been tracking my team’s progress during the regular season as they skate in and out of a playoff spot. I’m such a fan, I even care about their faceoff win percentage, goals against average, and power play percentage.
What I’m really doing when I compare the team’s performance to others is benchmarking. Everyone does it in some way, whether it is looking at the speedometer as you drive or poring over the stats on the back of a baseball card. By themselves, the numbers are interesting, but their real value is in the successes and challenges they reveal when compared with others.
Benchmarking in nonprofits
Nonprofits are no stranger to benchmarking. In a sector where donors want to know that their hard-earned money is being used effectively, and where positive outcomes are the ultimate measure of success, benchmarking is an essential tool for strategic planning. If a nonprofit doesn’t benchmark its outcomes, there is probably an oversight agency that will do it for them.
Most groups look at various ratios throughout the year. They may be concerned with the number of days of expenses in cash, the number of days of sales in collections, or maybe even the number of new wells built in sub-Saharan Africa.
Nonprofits use benchmarking analysis to uncover business processes and strategies, provide a baseline for improvement, and make data-informed decisions. Much of the information used to calculate key ratios for comparison with other organizations can be found in Form 990.
Measuring financial health
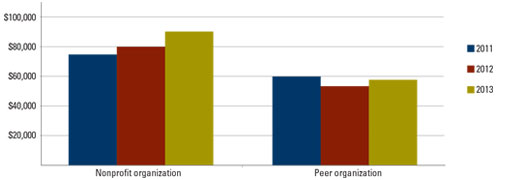
A great way of measuring the health of a nonprofit is to look at a combination of critical indicators over a period of time and in comparison with other organizations. For example, a social service organization may want to look at its program service revenues per full-time employee (FTE). Here is how the data might look:
| Revenue per FTE | |||
| Year | 2011 | 2012 | 2013 |
| Nonprofit organization | $75,000 | $80,000 | $90,000 |
| Peer organization | $60,000 | $55,000 | $59,000 |
The data can usually be visualized graphically to better illustrate the relationship between years.

If administrators had looked at this data for 2011 alone, they may have concluded that the group is close to its peer organization. However, when looking at the data over a three-year period, there is a trend that may indicate that the organization should invest in additional FTEs. Revenue continues to grow, which means the group may be able to increase staff and stay closer to the level of peer organizations.
Pinpointing cost-saving opportunities
International relief organizations often struggle to maintain strong programs and results while minimizing their administrative costs — donors and government funders demand it. They may want to analyze the related expenditures at in-country offices to see if any are too lean or could possibly be restructured to save funds.
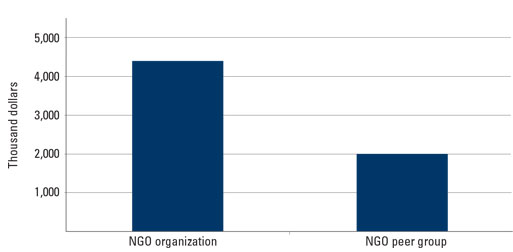
Using benchmarking, an organization can calculate its expenditures per sub-Saharan Africa office and then compare it to a group of similar nongovernmental organizations (NGO).

It is very important to know a peer group has a comparable budget. In the example above, the NGO peer group is made up of similar-sized organizations and it was noted that the organization was spending more than twice as much as the peer group per office in the sub-Saharan Africa region.
Make it meaningful and consistent
Faulty or inconsistent benchmarking results are worse than no results at all. In fact, bad numbers can be harmful and lead to poor planning and decision making. Here are a few tips to get the most from benchmarking data.
- Pick key ratios and critical indicators that make sense for your institution
- Choose more than two indicators but fewer than 10
- Measure at a specific point in time and over a period of time
- Benchmark against carefully selected peers
- Report all results, regardless of the outcome
- Present data to stakeholders in a clear but interesting manner
When you consider all of the benchmarks I could use to compare my favorite hockey team with the rest of the league, the number in the win column is the one that really counts. If nonprofits can use benchmarking indicators to reduce costs and fulfill their mission, they will usually come out on the winning side, too.
